
Reliable distribution growth remains one of the most important tailwinds for midstream MLPs. After all, investors often allocate to this space primarily for its attractive yield and consistent income. Learn more below about long-term distribution trends for the benchmark Alerian MLP Index (AMZ) and how debt reduction in the MLP space has increased free cash flow, supporting payout growth and buybacks.
Key Takeaways
- The Alerian MLP Index (AMZ) saw strong payout growth in 2025. Normalized distributions increased by 10.1%.
- Midstream MLPs have broadly reduced leverage over the past decade. Stronger balance sheets support financial flexibility and unitholder returns.
- The future looks bright for MLP investors. Most companies plan to keep raising payouts in the coming years.
Visualizing Index-Level Distribution Growth for MLPs
While VettaFi publishes a detailed recap of midstream dividends each quarter, visualizing payout changes over time at the index level — through a simplified chart — offers a valuable broader context. VettaFi’s standard quarterly updates typically highlight the percentage of index constituents — by both weighting and count — that have grown or maintained their payouts over the trailing quarter and year. The Alerian suite also discloses indicative yields, which represent the expected yield over the next 12 months based on the most recent dividend announcements.
Still, it can be helpful to compare historical payout growth against these indicative yields. Take the Alerian MLP Index (AMZ), VettaFi’s broadest MLP benchmark, as an example. On the first trading day of 2025, the index had an indicative yield of 6.86%. Driven by broad-based dividend growth across MLPs throughout the year, the actual year-over-year change in normalized payouts ultimately came in at 10.10%. Keep in mind that the Alerian MLP Infrastructure Index (AMZI) is a subset of AMZ.
Applying the Methodology
To be clear, there can be different ways to calculate index distribution changes. The methodology used in the chart below compares what AMZ constituents are paying out on an annualized basis. It compares annual normalized total distributions with the prior year to calculate a percentage change.
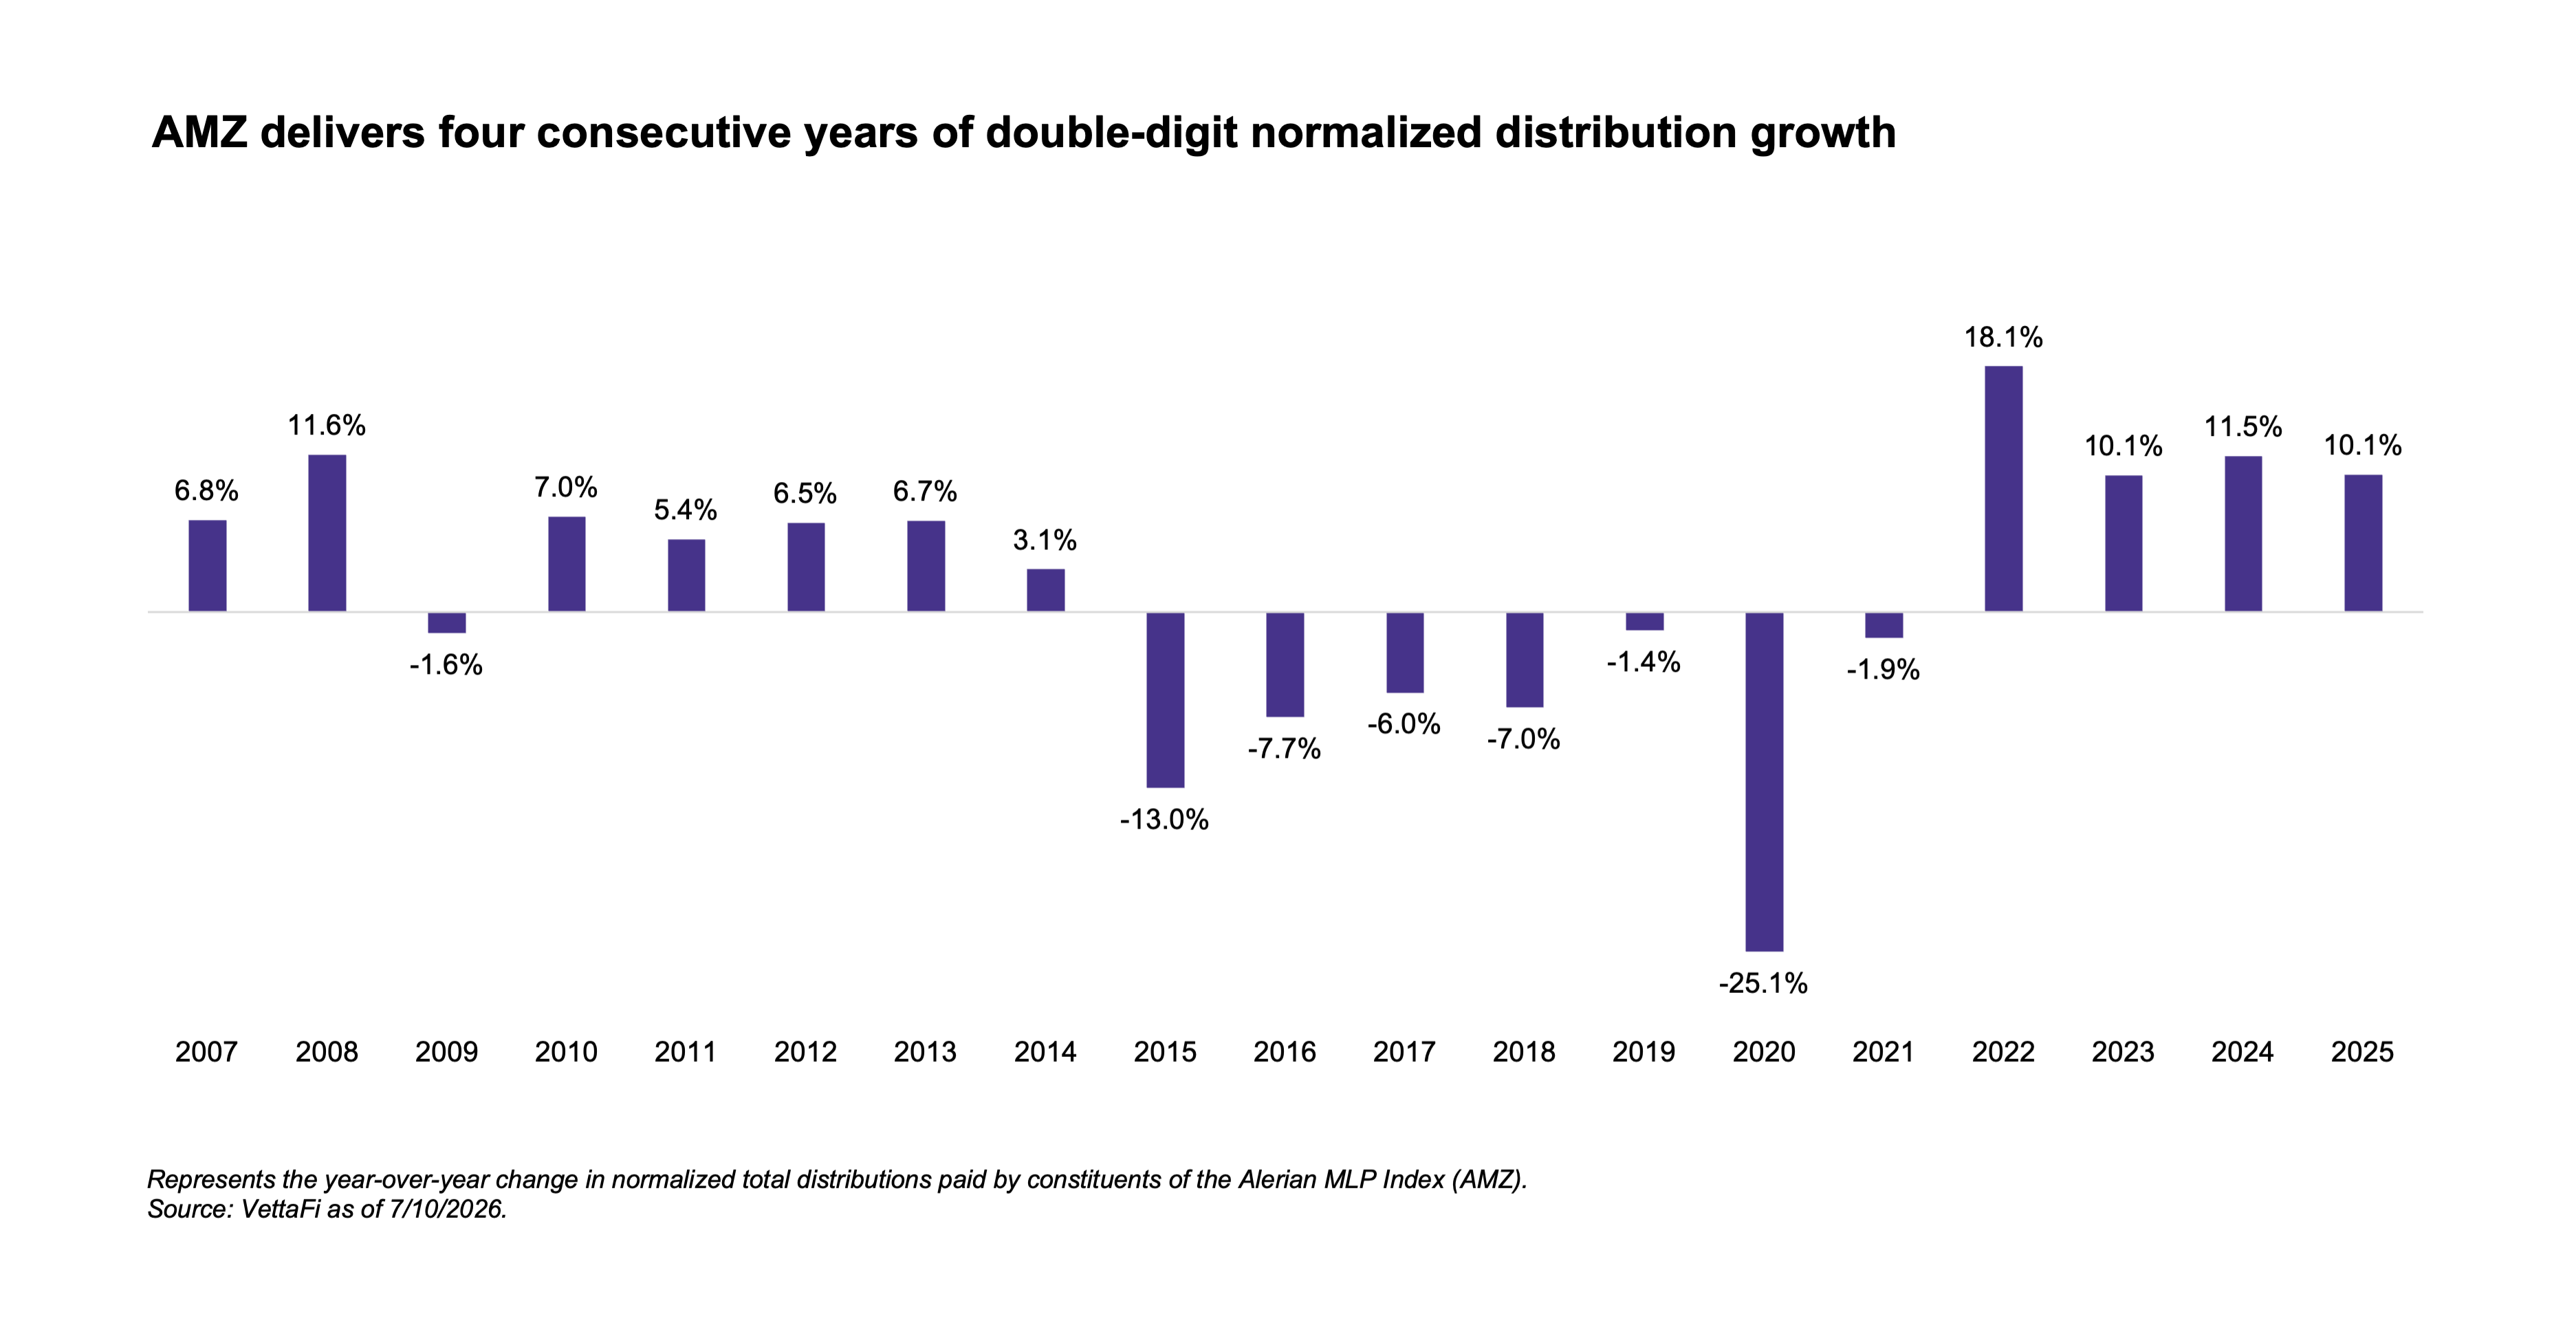 Distribution growth has been consistently strong in recent years. MLPs have historically focused on growing distributions, but the real shift came after an inflection in free cash flow generation that began in 2020 and 2021. In some cases, MLPs have been growing payouts after painful cuts made in 2020. However, Enterprise Products Partners (EPD) and MPLX (MPLX), each of which makes up ~10% of AMZ’s weighting, are examples of MLPs that have never cut their distributions. Since 2021, there has only been one distribution cut for an AMZ constituent. USD Partners, which had a very small weight in AMZ at the time, suspended its payout in 1H23.
A Look Back at a Volatile Era for MLP Distributions
To fully appreciate today’s strong distribution trends, it helps to look back at the volatile stretch between 2015 and 2020. This period represents a fundamentally different era for the MLP space. The pressure initially began in 2014, sparked by OPEC’s market-share battle with U.S. shale. As oil prices plummeted, the seven upstream producer MLPs included in AMZ at the time quickly slashed their payouts.
Even though most AMZ constituents held steady or increased their dividends during this downturn, the index-level data took a hit as high-yielding producers were booted from the index and replaced by lower-yielding names. By the end of 2017, upstream MLPs had completely exited the AMZ. Later, in 2020, the pandemic forced a wave of smaller, highly leveraged constituents to cut dividends to survive unprecedented macro uncertainty.
Since the pandemic, modern MLPs have transitioned to self-funded equity models with significantly lower leverage, robust free cash flow generation, and widespread buyback programs. This helped to establish a much stronger foundation for the sustainable distribution growth of recent years.
Balance Sheet Strength Supports Payout Growth
Today, the MLP space has a solid credit profile, with the AMZ index sitting at 65.5% investment-grade by weighting, as of June 30. Investment-grade credit ratings materially lower the cost of debt needed to fund large-scale projects or acquisitions. MLPs continue to target investment-grade ratings, with Hess Midstream (HESM) most recently achieving investment-grade status last year.
To maintain financial flexibility, MLPs have lowered their target leverage ratios over the past decade and paid down significant sums of debt. Leverage ratios (defined as net debt to adjusted EBITDA) have fallen from around 5x a decade ago to between 3x and 4x for most of the space today. The broader midstream space ended 2025 with an average leverage ratio of 3.8x, while large MLPs have generally seen leverage ratios decline over the years.
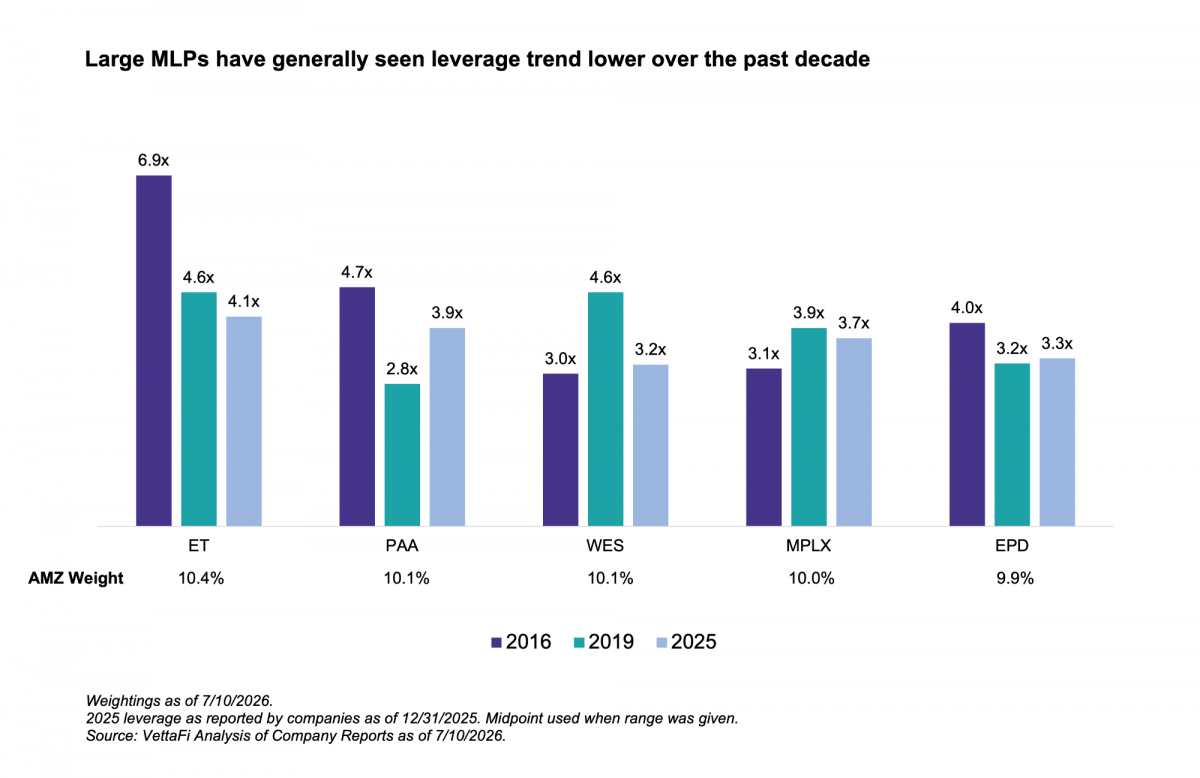 While Plains All American (PAA) saw its leverage tick up significantly in 2025, the company expects to get back towards the middle of its 3.25 – 3.75x target following the recent completion of its Canadian NGL divestiture. Similarly, MPLX’s leverage rose from 3.1x to 3.7x in 2025 following its acquisition of Northwind Midstream, and new debt hit the balance sheet before a full year of earnings could be realized. Most midstream companies reported leverage within or near their target ranges at the end of 2025.
Bottom Line
Looking ahead, the outlook for distribution growth in the MLP space remains constructive and most names are expected to raise payouts by mid-single-digits over the next several years. Supported by the visibility of long-term, fee-based contracts and an improving macro environment, midstream MLPs are operating from a position of strength. Ultimately, with strong balance sheets and healthy cash flows anchoring these payouts, income investors can continue to count on MLPs for steady distribution growth and generous yields.
Looking for midstream insights in your inbox? Subscribe here to keep a pulse on midstream investing through our weekly updates.
For more news, information, and analysis, visit the Energy Infrastructure Content Hub
Related Research:
U.S. Oil Production Outlook & Midstream Implications
1Q26 MLP/Midstream Dividends: Growth Trend Continues
2025 Midstream/MLP Leverage Ratios Signal Flexibility
Broad-Based Growth in 4Q25 Midstream/MLP Dividends
Breaking Down MLP Distribution Outlooks With AMZI
AMZ is the underlying index for the JPMCFC Alerian MLP Index ETN (AMJB), the ETRACS Alerian MLP Index ETN Series B (AMUB), and the ETRACS Quarterly Pay 1.5x Leveraged Alerian MLP Index ETN (MLPR). AMZI is the underlying index for the Alerian MLP ETF (AMLP) and the ETRACS Alerian MLP Infrastructure Index ETN Series B (MLPB).
vettafi.com is owned by VettaFi LLC (“VettaFi”). VettaFi is the index provider for AMJB, AMUB, MLPR, AMLP, and MLPB, for which it receives an index licensing fee. However, AMJB, AMUB, MLPR, AMLP, and MLPB are not issued, sponsored, endorsed or sold by VettaFi, and VettaFi has no obligation or liability in connection with the issuance, administration, marketing or trading of AMJB, AMUB, MLPR, AMLP, and MLPB.
