By Patrick Luby, Senior Municipal Strategist, Credit Sights
EXECUTIVE SUMMARY
- “Do Municipal Bond ETFs Improve Market Quality?” was the title of a research paper presented at the 9th Annual Brookings Municipal Finance Conference by Justin Marlowe of The University of Chicago, a er which we discussed our reaction to the assumptions and conclusions of the report.
- We concur with Professor Marlowe’s conclusion that muni ETFs do improve market quality and suggest some practical takeaways for municipal bond investors.
The 9th Annual Brookings Municipal Finance Conference was presented online this year on July 13 and 14. The Conference brings together academics, issuers, regulators and market practitioners to discuss recent research on the municipal bond market. We were invited to discuss the paper that asked “Do Municipal Bond ETFs Improve Market Quality?” which was presented by its author, Professor Justin Marlowe of the Harris School of Public Policy at The University of Chicago.
His systematic analysis of muni ETFs and market liquidity is an important addition to the market literature. By applying a rigorous analysis to the question, he confirms several insights that many participants might say are obvious or intuitive, but having a systematic view of the variations in liquidity provides insight into how and when to take advantage of those variations.
Below we highlight key sections of the paper and share an expanded version of the comments we delivered to the conference.
The Paper
The purpose of the paper is to answer concerns from regulators, policymakers and market participants about the implications for the potential mismatch in the liquidity between muni ETFs and the bonds that they hold. Those concerns were raised again in March when muni and other fixed income ETFs traded at wide discounts to their NAVs.
To examine how ETFs affect the liquidity of municipal bonds, the author started by identifying every municipal bond held in an ETF in any quarter from 2010 – 1Q20. He then identified open and closed end fund holdings of those bonds for the same period and then cross-referenced secondary market trades from the MSRB. His universe of 47,469 CUSIPs were traded 9.5 mn times over that span of time, of which 5.3 mn trades occurred when bonds were held in ETF portfolios.
A er applying several filters to the data (such as removing variable rate bonds, trades in recently issued bonds and excluding obvious data errors), he narrowed his data down to just secondary market sales to customers, resulting in a final dataset of 39,553 CUSIPs, 296,914 portfolio observations and 3.2 mn secondary market trades.
The author found that when ETFs hold a municipal bond, it trades more frequently and with lower price dispersion than bonds not held in an ETF. This effect was more pronounced for bonds rated triple-B and lower.
Here are some key ideas from the paper:
- That the liquidity premium in the muni market has “increased considerably since the Great Recession.” (Page 8.) We agree with that statement.
- That the decrease in liquidity was “due in large part to the collapse of the monoline muni bond insurers.” (Page 8.) We think this omits the significant impact of changes in dealer risk management practices since the recession.
- “ETFs have tended to hold positions in much larger bonds compared to mutual funds.” (Page 9.) We agree and note that one of the benefits of active management is that portfolios are not limited to only index eligible bonds and can seek incremental yield in smaller issues that ETFs cannot consider.
- “Uninformed noise traders in index securities like ETFs can increase trading volume without improving liquidity.” (Page 12, citing earlier papers from Hasbrough 2003 and Rhones and Mason 2019.) We are skeptical of this conclusion because every bidder helps to improve liquidity—especially when they bring a different view of the market.
- Once a bond arrives in an ETF portfolio, the size of the position does not have as significant an effect on the bond’s liquidity. (Page 17.) The liquidity benefit is reduced if a bond was held in an ETF portfolio in the prior quarter but not the current period. (Page 18.)
- Munis that have “arrived” in an ETF portfolio trade more o en. “In other words, ETFs are purchasing less liquid bonds and making them more liquid. This is a key finding given the previously-mentioned concern that ETFs do not make less liquid bonds more liquid, but rather take liquid bonds and make them even more liquid.” (Page 20.)
- Effects on turnover for BBB and lower rated bonds are three to four times stronger. (Marlowe presentation, slide 12.)
- “Bonds held by ETFs tend to trade more o en than bonds held by mutual funds but with little or no impact” on systemic risk. (Page 24.)
- The study’s findings imply that “at best, ETFs increase muni liquidity overall, and at worst, bonds held by muni ETFs are no less liquid than bonds held by mutual funds.” (Page 24.)
- The paper includes a detailed explanation of the construction and analysis of the dataset.
- This summary of the was prepared by CreditSights. The complete paper and the presentation slides can be found on the Conference website.
Our View
Liquidity Isn’t Free
There are multiple factors that influence market liquidity but the easiest way to illustrate its decline is by looking at dealer inventories. In the years prior to the GFC (Great Financial Crisis of 2007 – 2008), municipal bond market liquidity was more plentiful partly because broker/dealer balance sheets and risk capital were easier to access. Post-GFC, it became more common for firms to charge their trading desks and underwriters for their use of balance sheet and risk management became more systematic. (In addition, the total number of municipal bond dealers has steadily declined.)
The chart below includes the quarterly totals for the amounts of municipal bonds held by broker/dealers and the weekly totals of Primary Dealer holdings. It is important to point out that not only have Primary Dealer holdings fallen, but that as of July 1, municipal bond holdings made up less than 2% of Primary Dealers total fixed income market exposure. As of 1Q20, total broker/dealer exposure to munis was $14 bn, while they also held $56 bn in corporate and foreign bonds and $145 bn in equity market exposure—which includes positions in ETFs.

Trading, Liquidity & Price Discovery
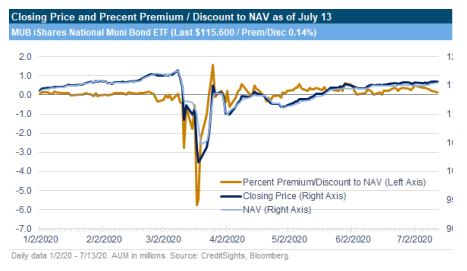
This chart of YTD volumes of the municipal bond and ETF markets shows the tremendous increase in trading in March, when bond trading peaked at more than double the YTD daily average and ETF secondary market trading was more than triple this year’s daily average. Prices were down sharply in both markets, and we contend that it was the price discovery in ETFs that helped define the new levels in the market.

As we wrote in Fixed Income ETFs & Market Illiquidity, “We believe that too much emphasis is placed on the NAV as the most accurate and reliable gauge of value—especially in volatile market conditions and exactly because there is more trading in the ETFs than in the underlying bonds in the portfolios or the indices that the ETFs are tracking. The thousands of daily trades in the large and actively traded fixed income ETFs provide real-time insight into the collective market sentiment—much more so than the thousands of evaluations that go into the NAV calculations and which can lag behind the prices of the ETFs.”
For example, in the two-week period from March 16 to 27, of the nine long term bonds in MUB’s top 10 holdings, there were a total of 164 trades in matching bonds (with a combined total face amount of $69.3 mn); that’s an average of 18 trades and $7.7 mn per CUSIP. Over the same period of time there were over 160,000 trades in MUB with a total market value traded of $4.5 bn.
Key Take-Away
The author’s finding that muni ETFs are purchasing less-liquid bonds and making them more liquid, and that the effect is more pronounced for lower quality bonds confirms many market participants “gut instinct,” but it is the drop-off of the liquidity benefit a er a CUSIP leaves the ETF portfolio that suggests to us a reason why this is so.
To make a market in a fixed income ETF, the APs need to have an up-to-the-minute opinion of the values of every bond in that fund’s creation basket (and, ideally, all the bonds in the portfolio). In addition, dealers will know that if they buy matchers to bonds held in an ETF, that the fund’s portfolio manager may be an interested buyer. Consequently, the inclusion of a CUSIP in an ETF portfolio provides APs and dealers with an incentive to make a tighter market in those bonds.
That tendency prompted us to suggest two questions for further study:
- Compare CUSIPs from transparent vs semi-transparent ETFs (For example, an indexed ETF that reports holdings every day, such as MUB, versus a fund that reports less frequently, such as VTEB.)
- Compare CUSIPs from indexed versus actively managed ETFs (since the actively managed fund would not be limited to only bonds that are index eligible).
Implementation
Because of the overall decline in secondary market liquidity, we have been proponents of the idea that municipal bond portfolios should include a liquidity allocation, so that there will be positions that could be easily sold if the need arises. Formerly, we have suggested the large and liquid muni ETFs as a means to pursue that objective, but since this study shows that the liquidity benefit extends to the bonds in the ETFs, investors can consider allocating their liquidity budget into CUSIPs that match the holdings in those large and liquid ETFs.
Additional Reading
We wrote about our view of liquidity in 2020 Muni Outlook Part 1: Demographics Reign and 2019 Muni Outlook Part 1: Prepare for Changes.
Our discussion of ETF price discovery Fixed Income ETFs & Market Illiquidity.
The agenda, presentation materials and video replay (when it becomes available) from the Brookings Municipal Finance Conference can be found HERE.
This Report is for informational purposes only. Neither the information contained in this Report, nor any opinion expressed therein is intended as an offer or solicitation with respect to the purchase or sale of any security or as personalized investment advice. CreditSights and its affiliates do not recommend the purchase or sale of financial products or securities, and do not give investment advice or provide any legal, auditing, accounting, appraisal, valuation or actuarial services. Recommendations made in a report may not be suitable for all investors and do not take into account any particular user’s investment risk tolerance, return objectives, asset allocation, investment horizon, or any other factors or constraints.
Information included in any article that includes analysis of documents, agreements, controversies, or proceedings is for informational purposes only and does not constitute legal advice. No attorney client relationship is created between any reader and CreditSights as a result of the publication of any research report, or any response provided by CreditSights (including, but not limited to, the ask an analyst feature or any other analyst interaction) or as the result of the payment to CreditSights of subscription fees. The material included in an article may not reflect the most current legal developments. We disclaim all liability in respect to actions taken or not taken based on any or all the contents of any research report or communication to the fullest extent permitted by law.
Reproduction of this report, even for internal distribution, is strictly prohibited. Receipt and review of this research report constitutes your agreement not to redistribute, retransmit, or disclose to others the contents, opinions, conclusion or information contained in this report (including any investment recommendations or estimates) without first obtaining express permission from CreditSights. The information in this Report has been obtained from sources believed to be reliable; however, neither its accuracy, nor completeness, nor the opinions based thereon are guaranteed. The products are being provided to the user on an “as is” basis, exclusive of any express or implied warranty or representation of any kind, including as to the accuracy, timeliness, completeness, or merchantability or fitness for any particular purpose of the report or of any such information or data, or that the report will meet any user’s requirements.
CreditSights Risk Products, including its ratings products and related information, are provided by CreditSights Analytics, LLC. CreditSights Limited is authorised and regulated by the Financial Conduct Authority (FCA). This product is not intended for use in the UK by retail clients, as defined by the FCA. This report is not intended for distribution to, or use by any person or entity in any jurisdiction or country where such distribution or use would be contrary to local law or regulation.
Certain data appearing herein is owned by, and used under license from, certain third parties. Please see Legal Notices for important information and limitations regarding such data. For terms of use, see Terms & Conditions.
If you have any questions regarding the contents of this report contact CreditSights at [email protected].
© 2020. CreditSights, Inc. All rights reserved.
