By Clayton Fresk, Stadion Money Management
Over the past year or so, the broad US equity market has been on a rather one-way churn higher. There hardly looks to be any real downturns outside some election-based trepidation, which was quickly solved by the Trump Bump.
Throw in that the rally has been tech-fueled (as evidenced by the reemergence of talk of FANG stocks), and it should not be a huge surprise that dividend stocks/indices are underperforming. What may be of surprise is the degree to which they are underperforming.
While there is a plethora of Dividend ETFs available in the market, for the following analysis I used the underlying index data for the top eight broad dividend ETFs based on AUM, which is as follows:
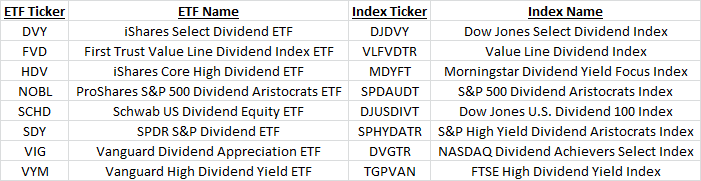
Additionally, rather than run each index individually, I created an Average Dividend Index return series. In addition to making the analysis cleaner, this also balanced out some of the methodology differences in the aforementioned indices (such as GICS sector exposure).
The first chart is the relative performance of this Average Dividend Index as compared to the S&P 500 since September 2006 (which was the latest inception of the aforementioned indices):
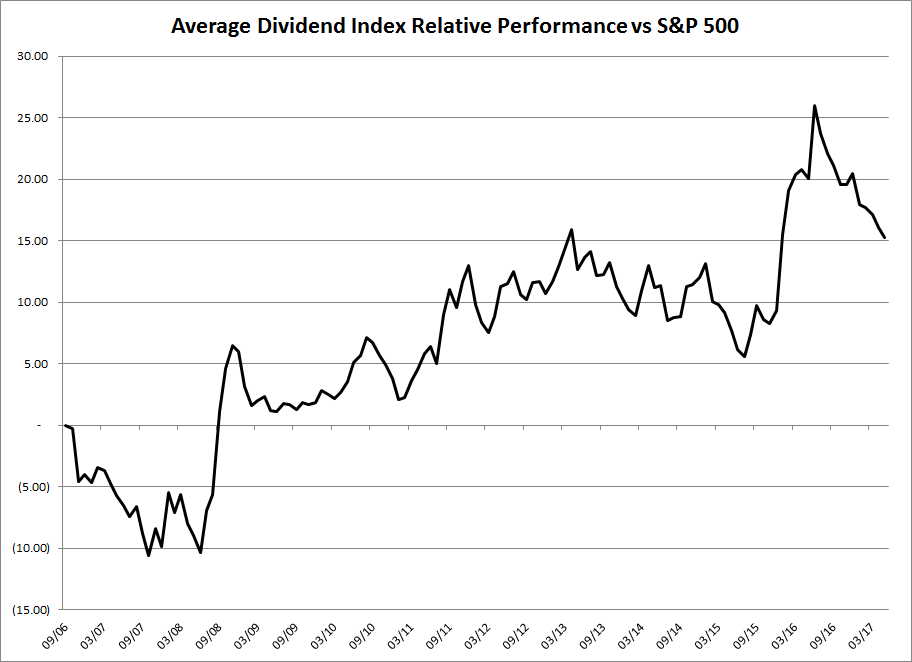
While there is expected ebb and flow in the relative performance, the sharp drop off on the right hand side of the graph (performance since 6/30/2016) is quite noticeable. Now while some of this could be mean reversion from the outperformance spike in early 2016, the degree of the reversion seems a bit extreme.
Related: Putting the ‘Fun’ Back in Exchange Traded Fund
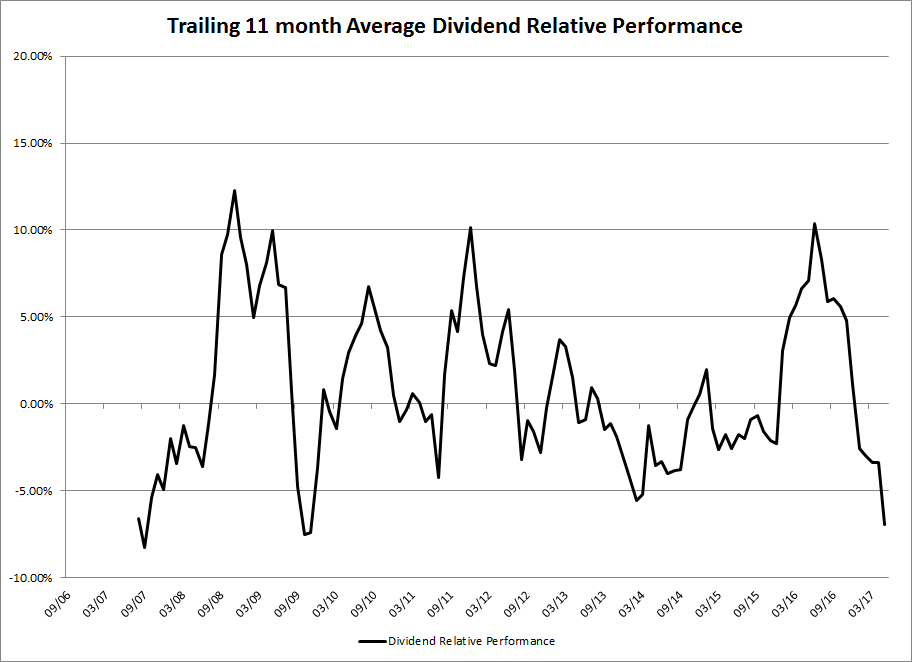
While the absolute performance of this average dividend index is decently strong on its own (10.23% since 6/30/16), the relative performance of it versus the S&P 500 (at +17.16%) makes it seem a bit more paltry. This next chart shows the rolling 11-month relative performance going back to the same 9/2006 date. I chose an 11-month period to correspond with the peak in relative performance from the chart above (6/30/16), with the analysis ending at the recent month end.