
Technical analysis – what kind of tool can it be for investors? Some look at a series of bars and colored lines and see a form of analysis that is too arbitrary. Others build entire approaches to investing around the month-by-month, day-by-day, and perhaps even hour-by-hour ups and downs. Somewhere in between investors and advisors can make great use of ETF technical analysis to make more informed decisions – relevant as the American Century Focused Large Cap Value ETF (FLV) has recently lit up.
See more: “American Century’s Venkataraman on Duration, Yield in 2023”
What kind of technical indicators do investors look at? Of course there are plenty, but some are more popular than others. Principally, technical analysis indicators tell us how an ETF’s price is changing – which is perhaps more advantageous to those who trade ETFs daily or weekly. For long term investors, though, knowing where an ETF’s price may go can help in identifying entry points and exit points for a move.
Common Indicators In ETF Technical Analysis
To do this, examine moving price averages, whether on a 20, 50, or 200-day measure. Those simple moving average (SMAs) can offer notable clues. For example, if the 50 day average price of the ETF becomes higher than its 200-day average, that suggests an ETF may have broken into another price tier recently. It could be a candidate for further momentum.
Another factor to watch when trading ETFs is whether they’re oversold or overbought. Investors and advisors can eye that trend analysis via the Relative Strength Index (RSI) Indicator.
The RSI attempts to measure the “speed and magnitude” of an ETF’s price changes to determine whether it’s being sold or bought too much. Introduced in 1978, the RSI is an “oscillator” signal. That means it oscillates between overbought territory, at or above 70, and oversold territory, when it falls below 30.
Finally, chart patterns can indicate support and resistance points. This is where drawing lines comes in, like in the below example.
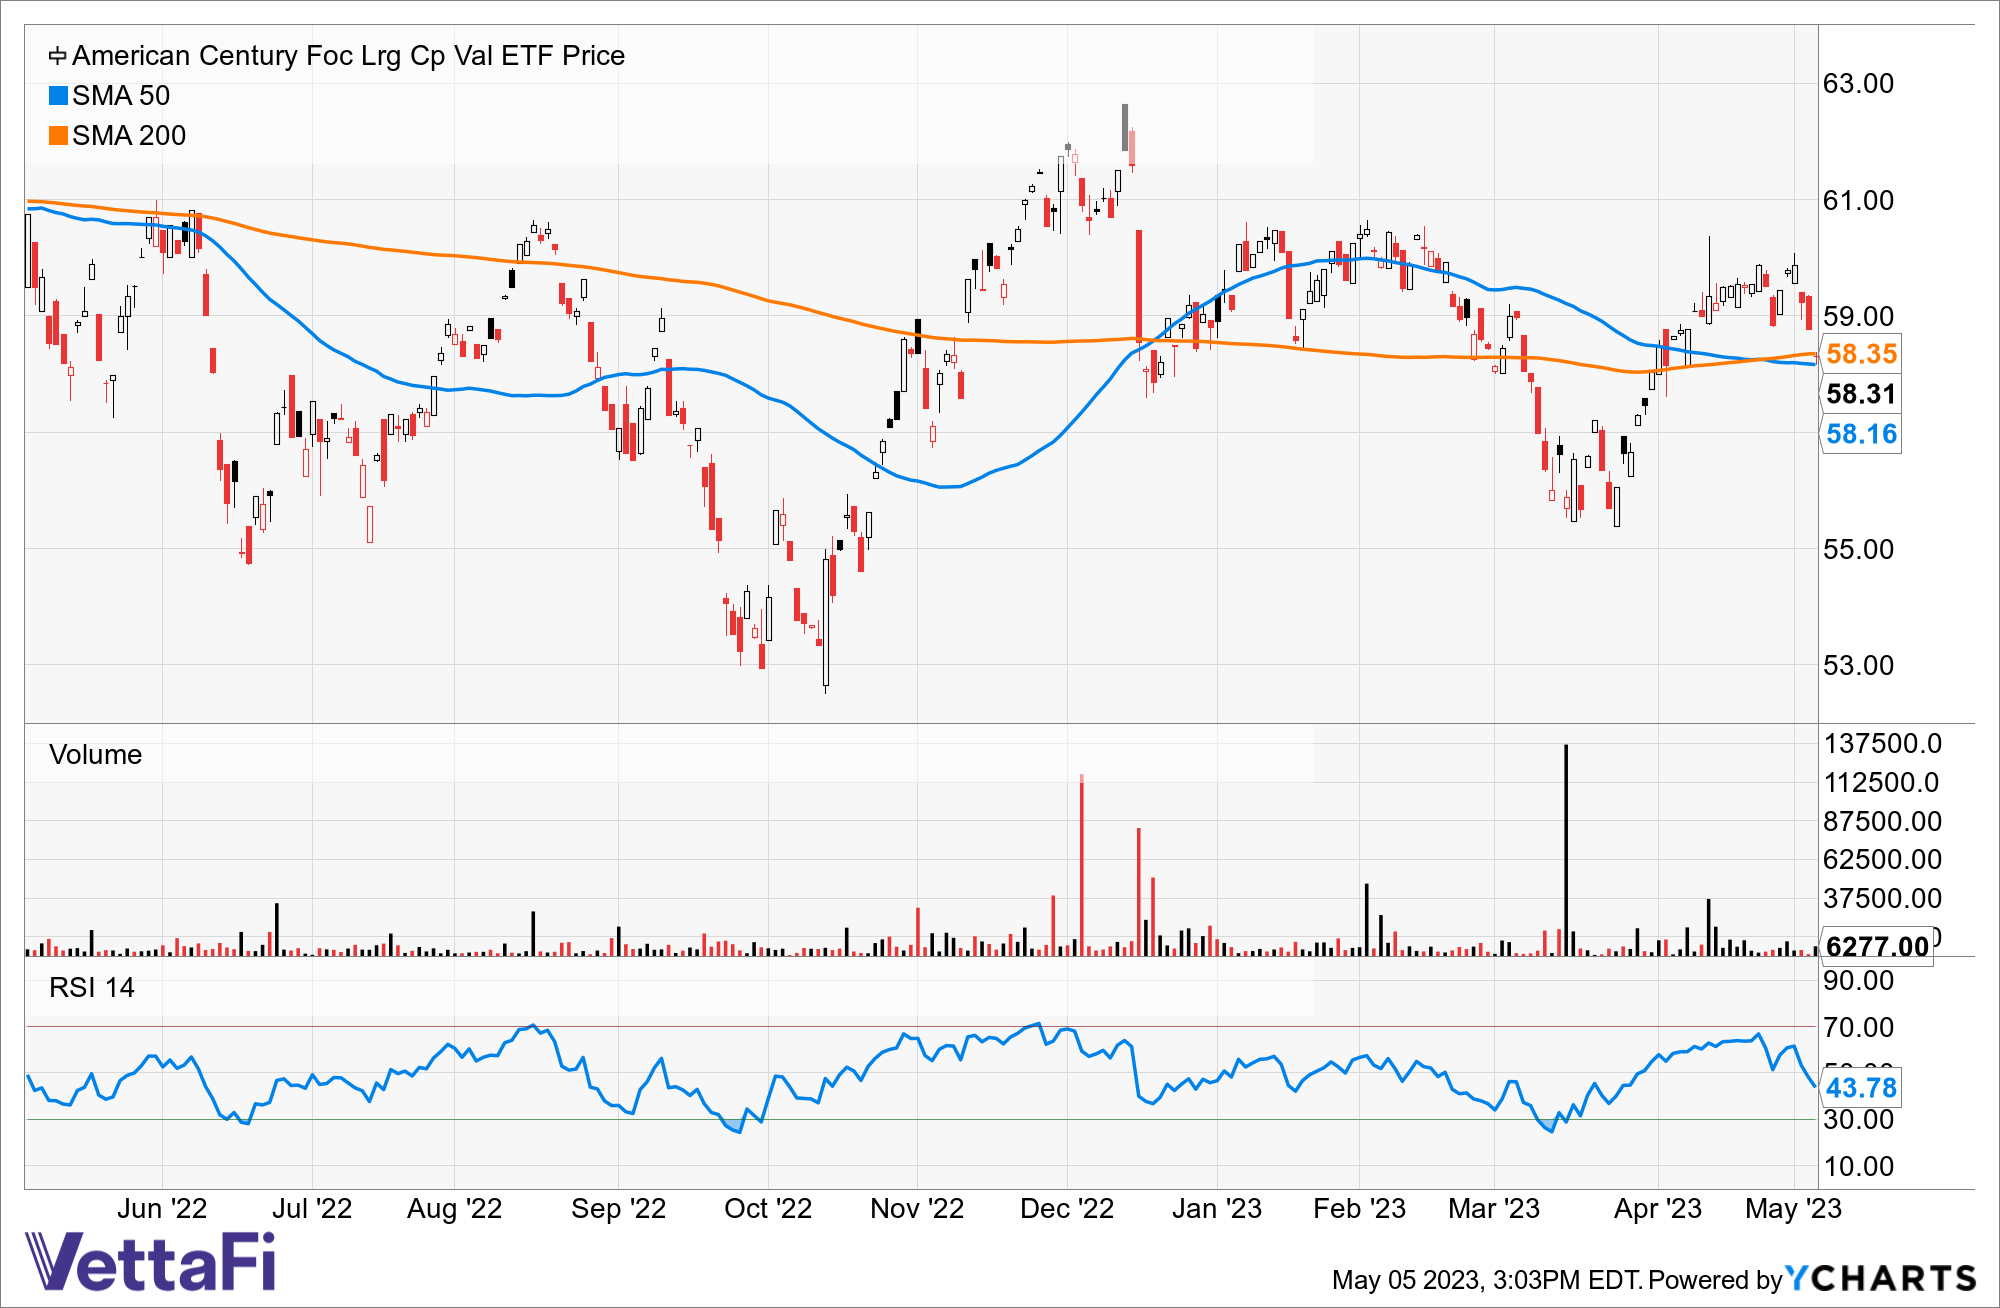
In this case, FLV has signaled a buy per the aforementioned SMA indicators, with its price sitting above both its 50-day and 200-day SMAs. One can see the ETF reached a “support” price point at which the price has hit a floor in March, which then creates a “W” or “double bottom” pattern in which markets see a price fail to drop past a certain point twice.
See more: “Large-Cap ETF FLV Hits 3-Year ETF Milestone”
All kinds of patterns can be found in candlesticks, and can provide some more information about an ETF or security.
That said, ETF technical analysis has its limits. It examines trade activity rather than the holdings in a given ETF, for example. Consider it as one tool among many for investors looking to brush up on their ETF toolset.
For more news, information, and analysis, visit the Core Strategies Channel.
