
Commodities ETFs incurred net outflows of $6.3 billion in July, shrinking the year-to-date net inflows total to $8.6 billion. While heavy inflationary pressures may be easing as we head into the fall, investors remain eager to learn about commodities ETFs, particularly as war in Ukraine persists. The commodities general category was the second most popular based on traffic data of more than two million unique monthly visits to the VettaFi ETF Database platform, ahead of European equities, government bonds, high yield bonds, technology equities, and many others.
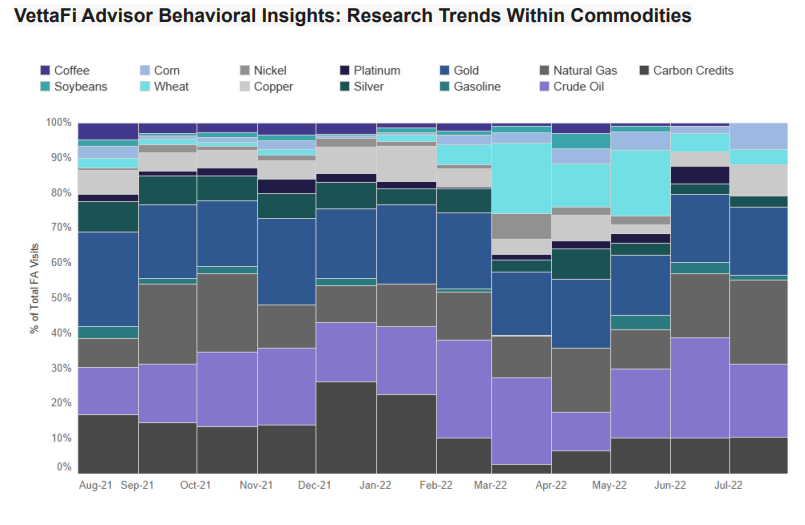
However, during July there were notable shifts in interest among the commodity sub-categories by advisors using VettaFi’s platform. For example, natural gas commodity products spiked to 24% of the commodity asset category’s traffic in July, up from 18% in June, and represented the largest sub-category. Meanwhile, crude oil commodities shrunk to 21% from 29% a month earlier; gold ETFs like the SPDR Gold Shares (GLD) held steady in July at 19% of the asset category’s traffic.
VettaFi does not include equity ETFs tied to gold or copper, such as the VanEck Gold Miners ETF (GDX) or the Global X Copper Miners ETF (COPX), within the commodities sub-categories.
“Natural gas prices sold off in mid-June on news of an extended outage at the Freeport LNG export terminal, which resulted in lower demand,” explained Stacey Morris, head of energy research at VettaFi. “However, natural gas prices saw a significant rebound in July, gaining more than 50%, as excessive heat in many parts of the U.S. drove strong demand for power generation.”
The United States Natural Gas Fund LP (UNG) is the largest natural gas ETF, with approximately $550 million in assets. The futures-based ETF experienced $176 million of net outflows in the first seven months of 2022, including $56 million of net outflows in July. New money had not yet materialized even as UNG more than doubled in value.
The ProShares Ultra Bloomberg Natural Gas ETF (BOIL) is the second-largest, with approximately $330 million in assets. BOIL is a two-times leveraged ETF, which comes with enhanced risks as well as rewards. While BOIL’s price has nearly tripled in value, investor returns are likely different due to the compounding impact and the volatility of the ETF.
While other commodity categories receive less traffic, there were also some shifts in July. For example, copper products, like the United States Copper Index Fund (CPER), which has $140 million in assets, were in focus. Traffic rose to 9.0% of the commodities category from a prior 4.1%, even as the platinum sub-category went from 5.1% to 0%.
Among agriculture sub-categories, while interest in wheat modestly waned (4.5% from 5.1%), there was a spike in interest in learning about corn (7.5% from 2.0%). The Teucrium Corn Fund (CORN), which has $200 million in assets, had recently risen in value 15% for the year.
Corn, wheat, and other agriculture commodity traffic is down from monthly levels between March and May as supply has dried up due to the Russian invasion of Ukraine and related impacts. Indeed, in March 2022, commodities ETFs represented 20% of VettaFi’s ETF traffic, despite the category representing a low single-digit percentage of industry assets. It fell to 12% in June and fell again to 9.4% in July, but still it represented a larger slice of VettaFi’s ETF data traffic than the category’s asset base.
With the broad array of commodities ETFs providing targeted exposure, we are pleased that so many advisors are turning to the VettaFi database to learn about them.
To see more of Todd’s research, reports, and commentary on a regular basis, please subscribe here.
For more news, information, and strategy, visit the Commodities Channel.
