
Our emerging markets watchlist tracks nine indexes from emerging economies around the world. Emerging markets are countries with economies in the process of rapid growth and industrialization. They often present higher potential returns than developed markets, but also carry greater risk. The list includes the Merval from Argentina, IBOVESPA from Brazil, Shanghai from China, BSE SENSEX from India, IDX from Indonesia, S&P/BMV IPC from Mexico, KOSPI from South Korea, S&P IPSA from Chile, and MOEX from Russia.

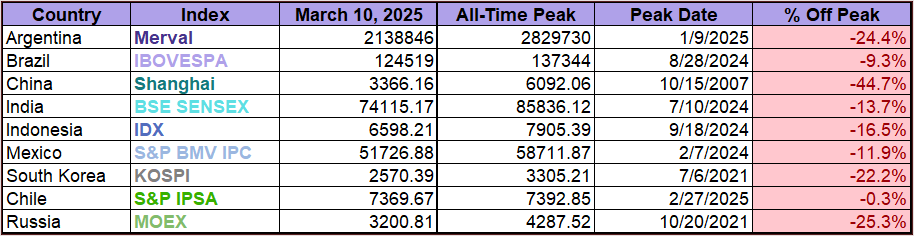
Six of the nine indexes on our emerging markets watch list have posted gains through March 10, 2025. Russia’s MOEX is in the top spot with a year to date gain of 11.1%. Chile’s IPSA is in second with a year to date gain of 10.1% while South Korea’s KOSPI is in third with a year to date gain of 8.84%.

To provide additional context on where these indexes stand relative to their historical peaks, the table below shows each index’s current value, all-time peak, the date of that peak, and how far it is from that record level.
World Indexes and Recent Recessions
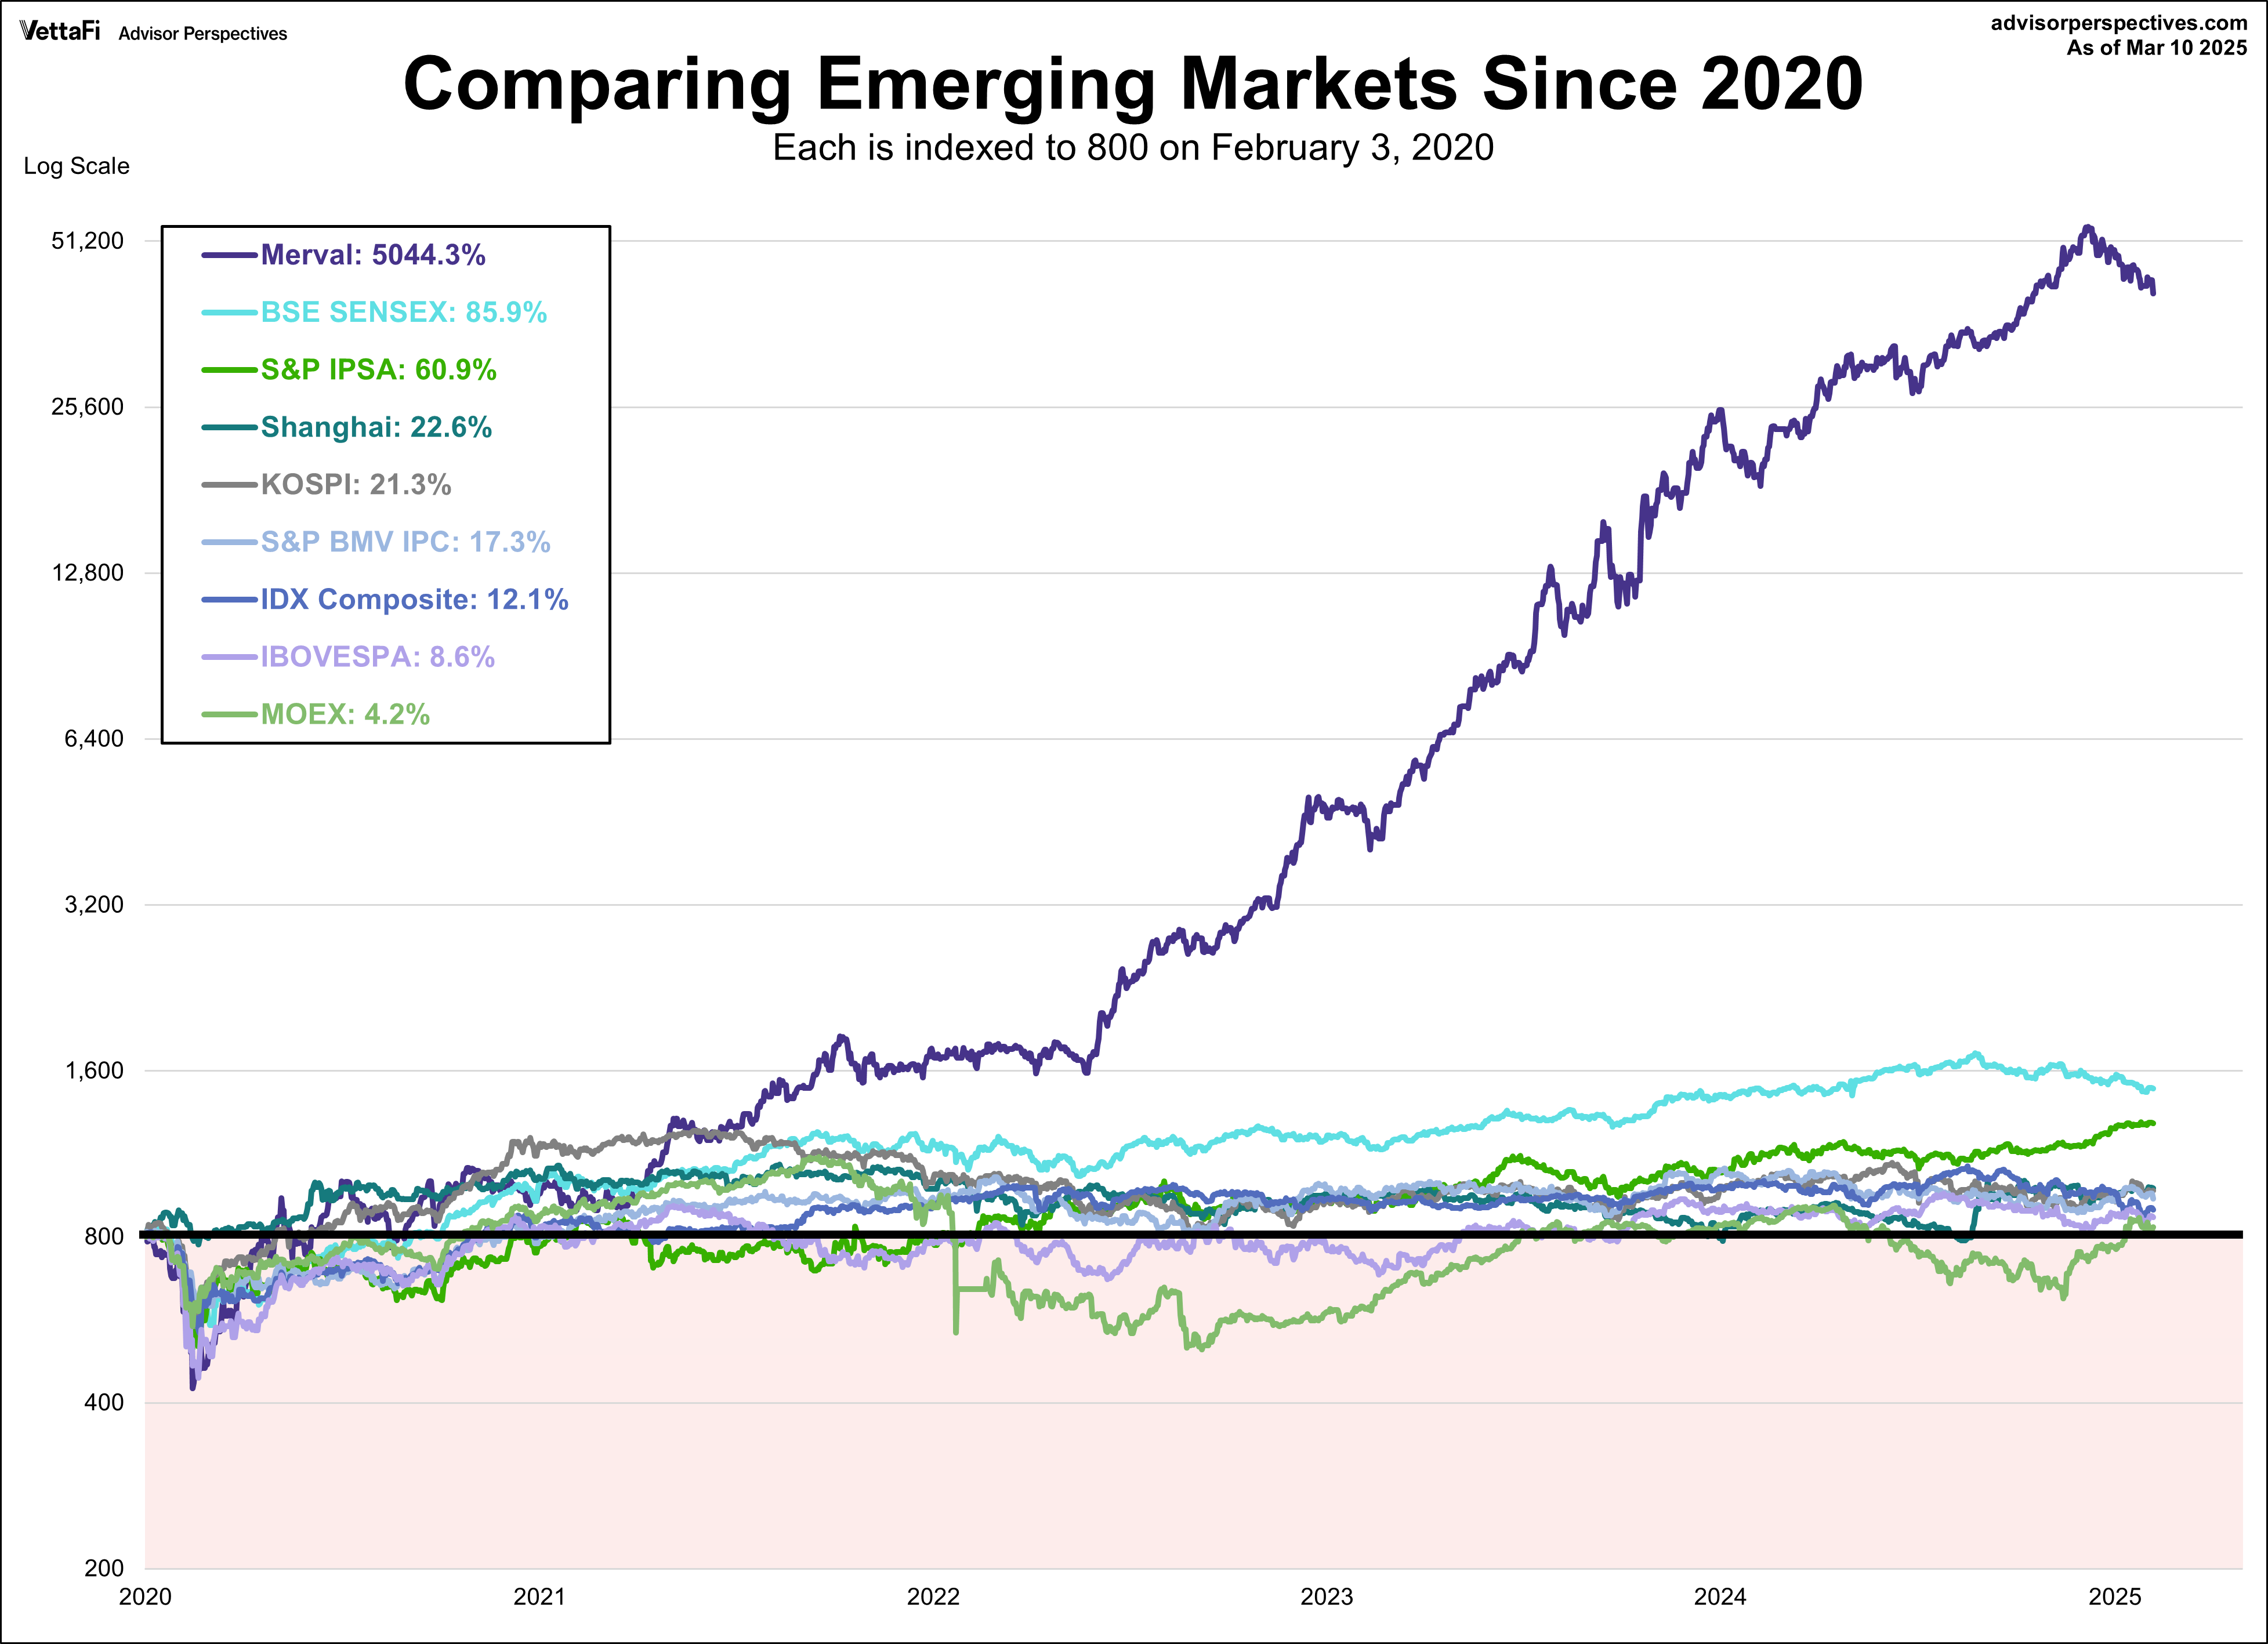
Let’s start with a very recent chart with the latest recession. We’ve used February 3, 2020 for our start date (this is the official NBER recession start). The outlier is clearly the Merval index from Argentina so I’ve included an additional chart excluding it for a better visual comparison of the other indexes.
 |
 |
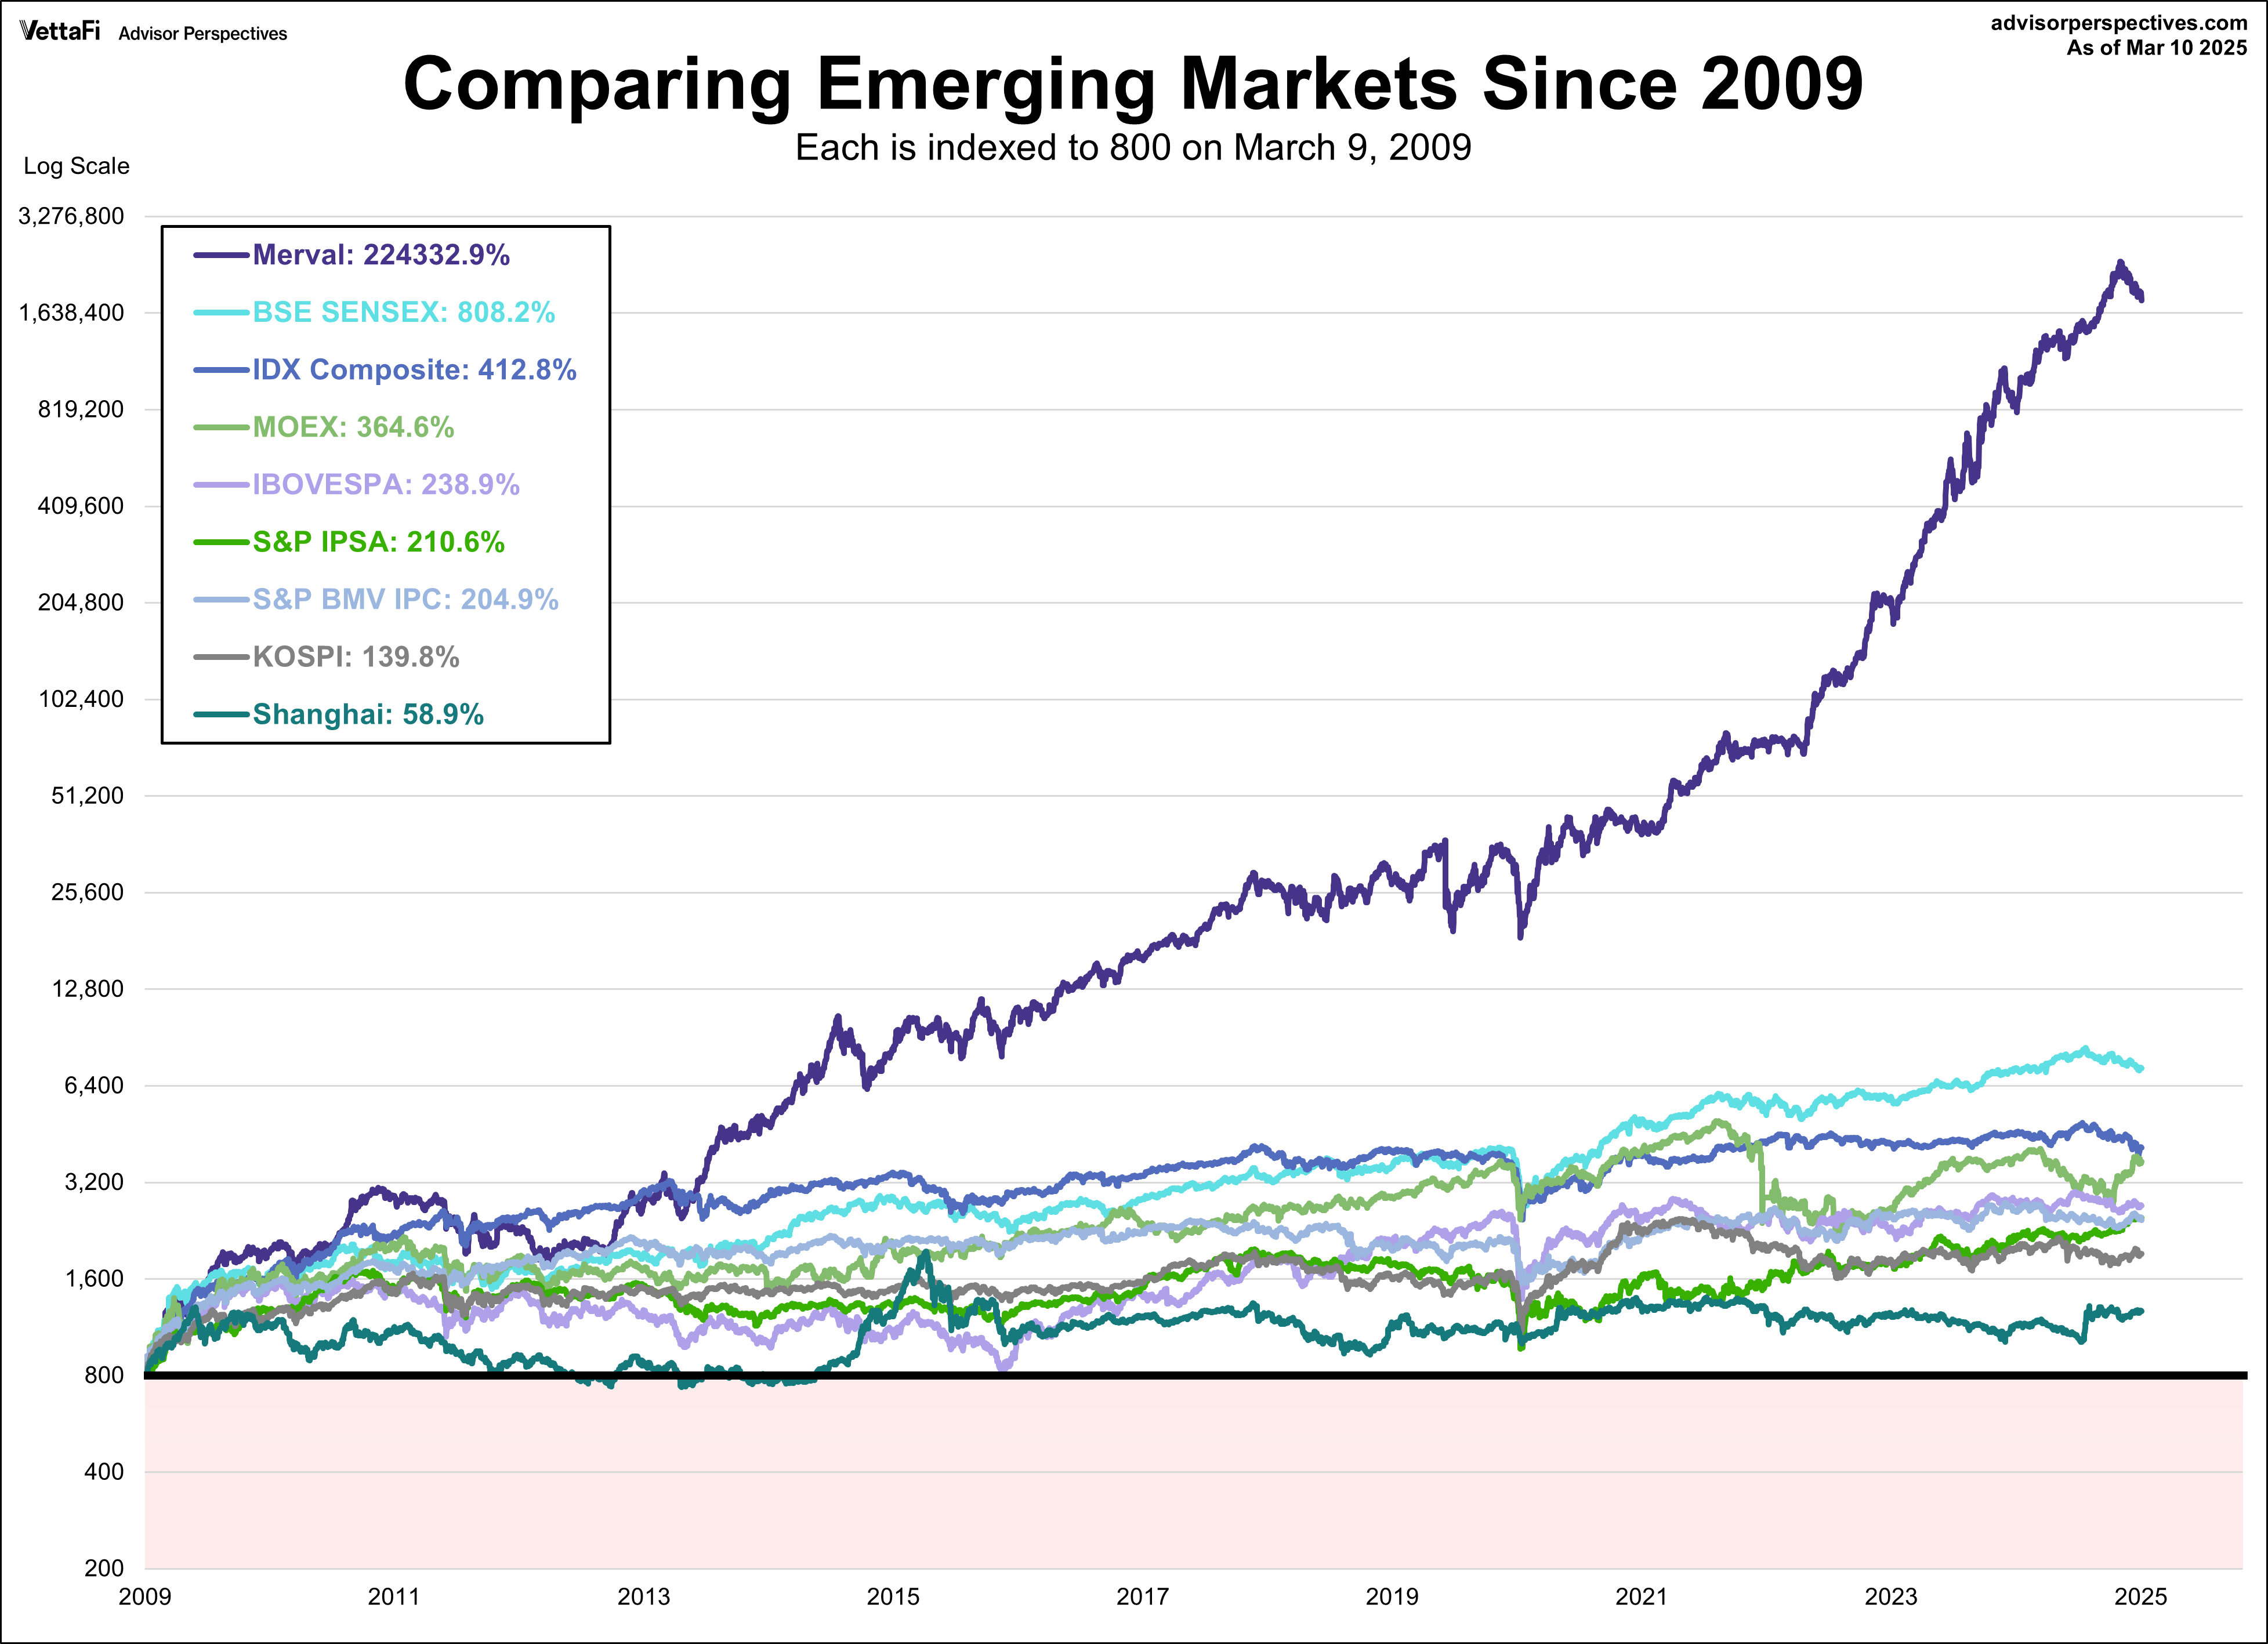
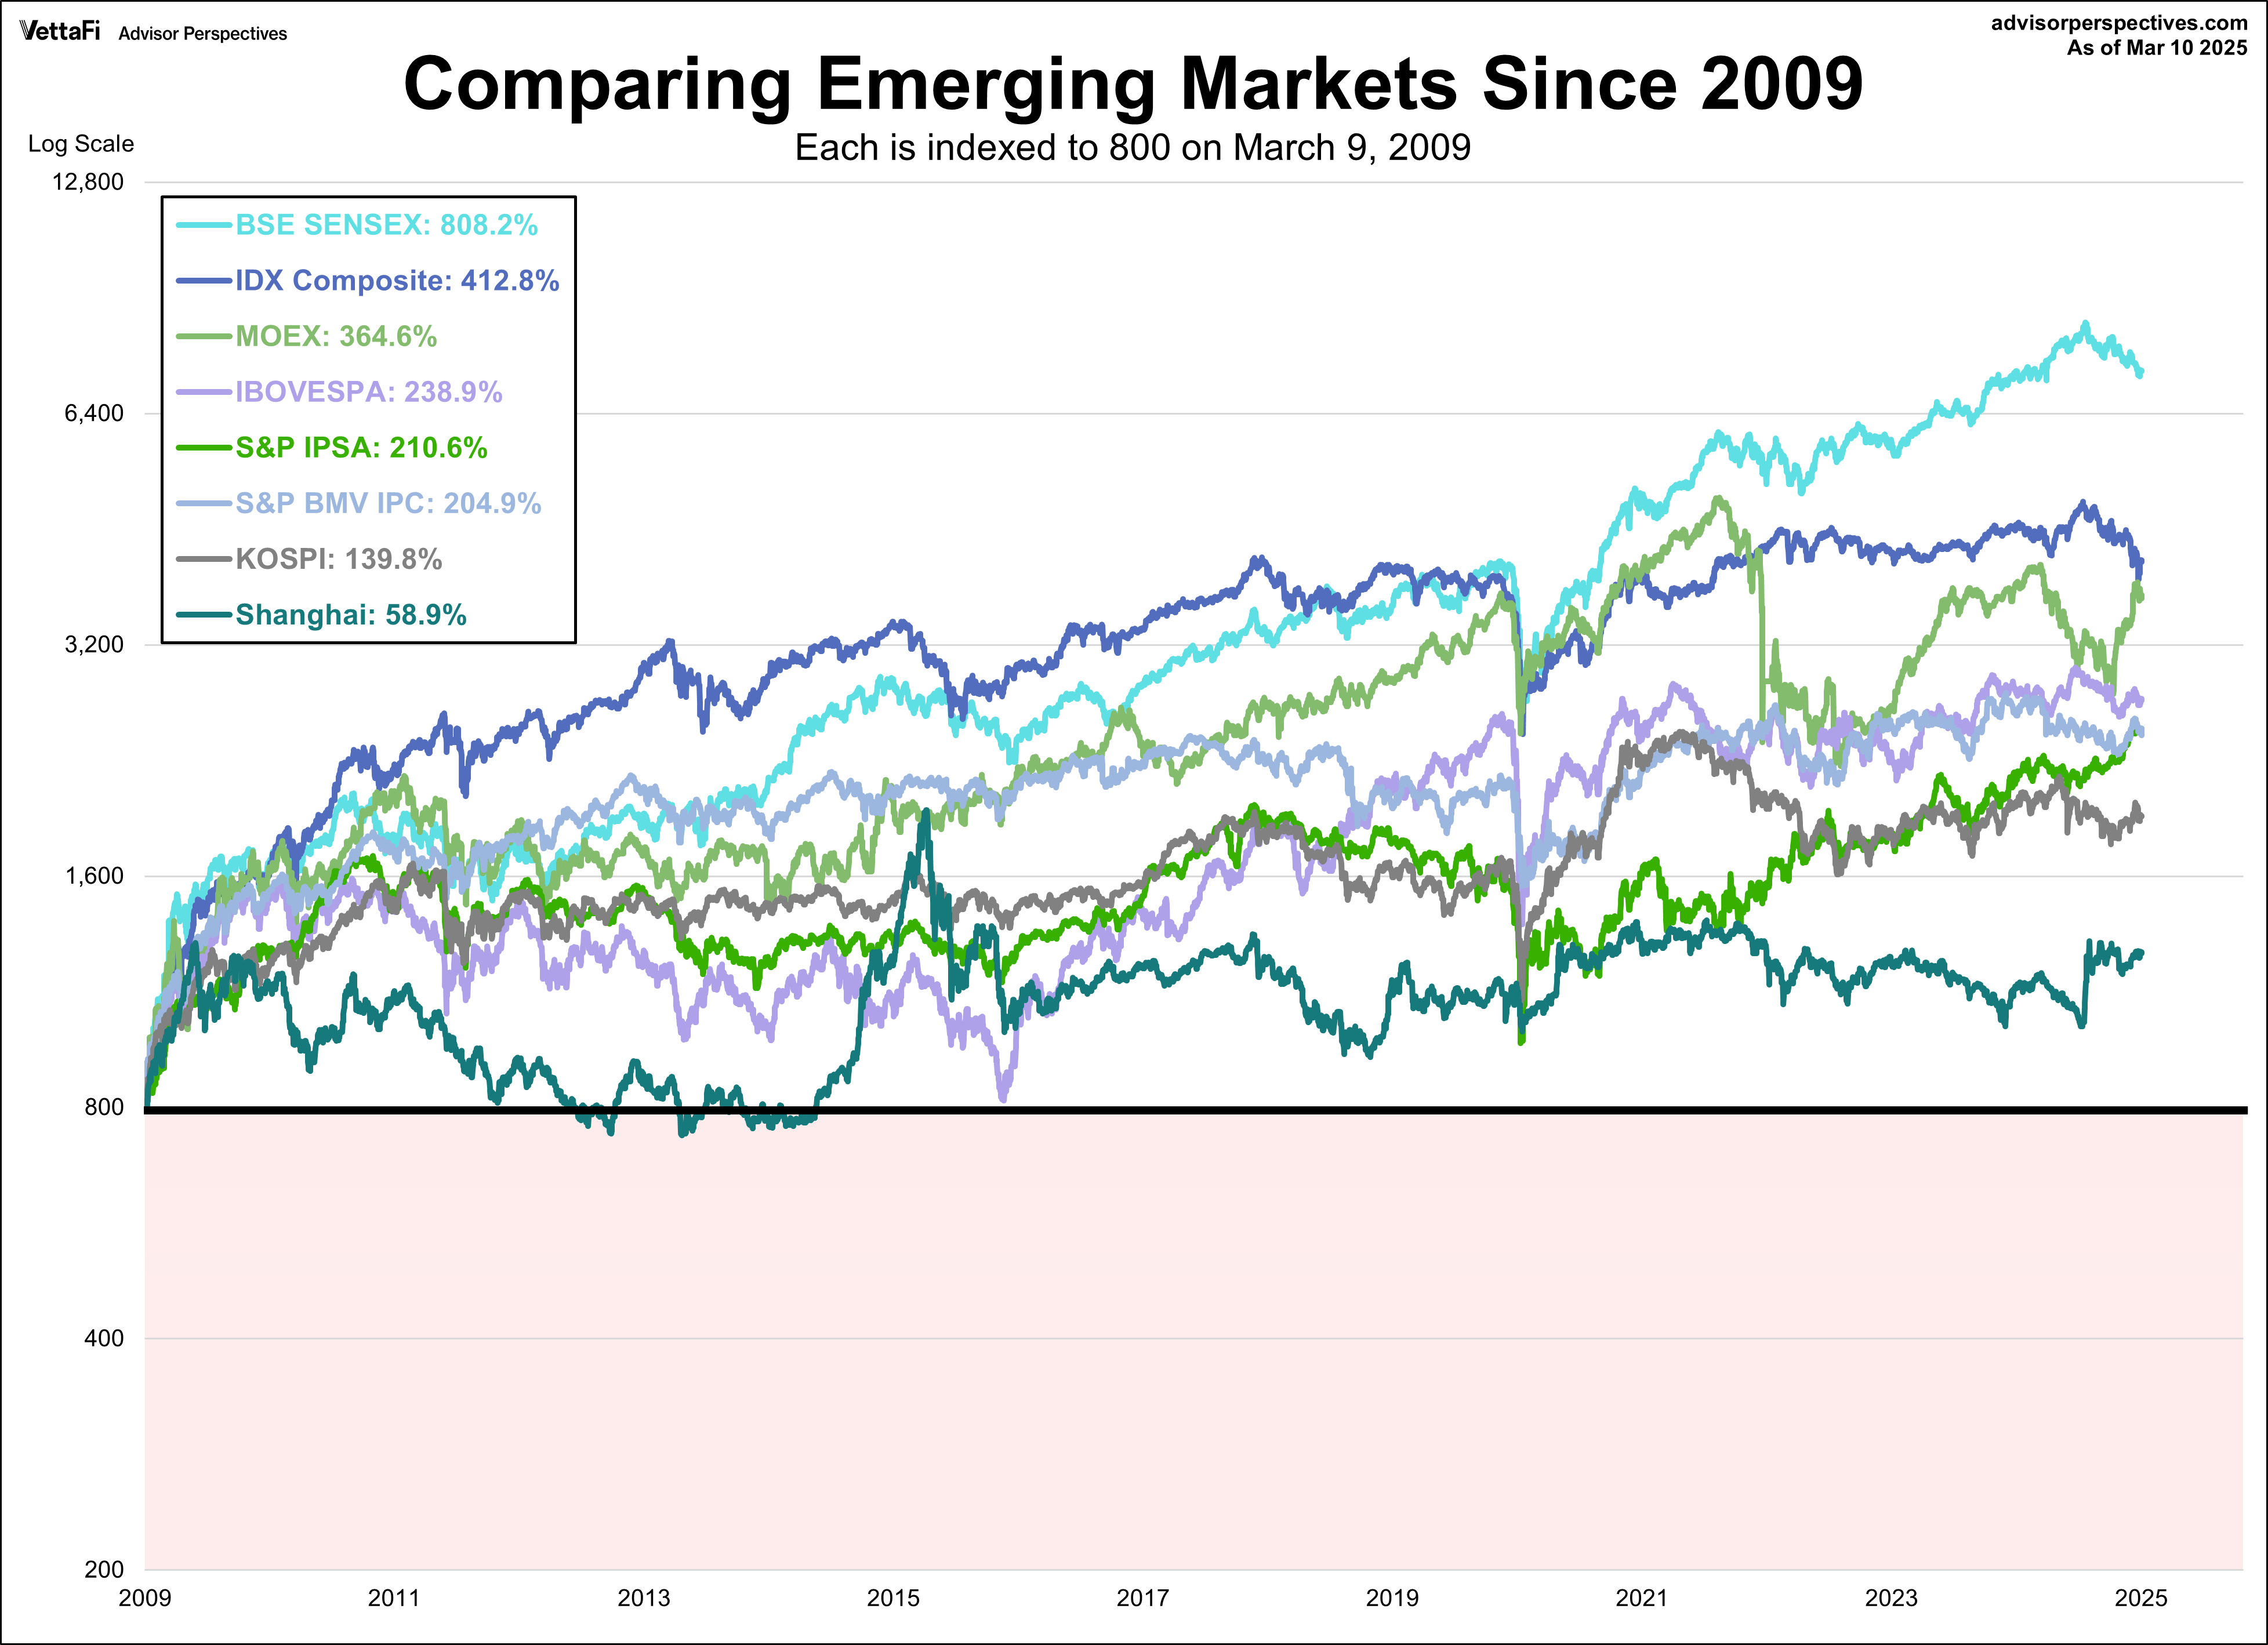
The chart below illustrates the comparative performance of world markets since March 9, 2009. The start date is arbitrary, however, by aligning on the same day and using a log-scale vertical axis, we get an excellent visualization of the relative performance. I’ve indexed each of the eight to 800 on the March 9th start date. The callout in the upper left corner shows the percent change from the start date to the latest weekly close.
 |
 |
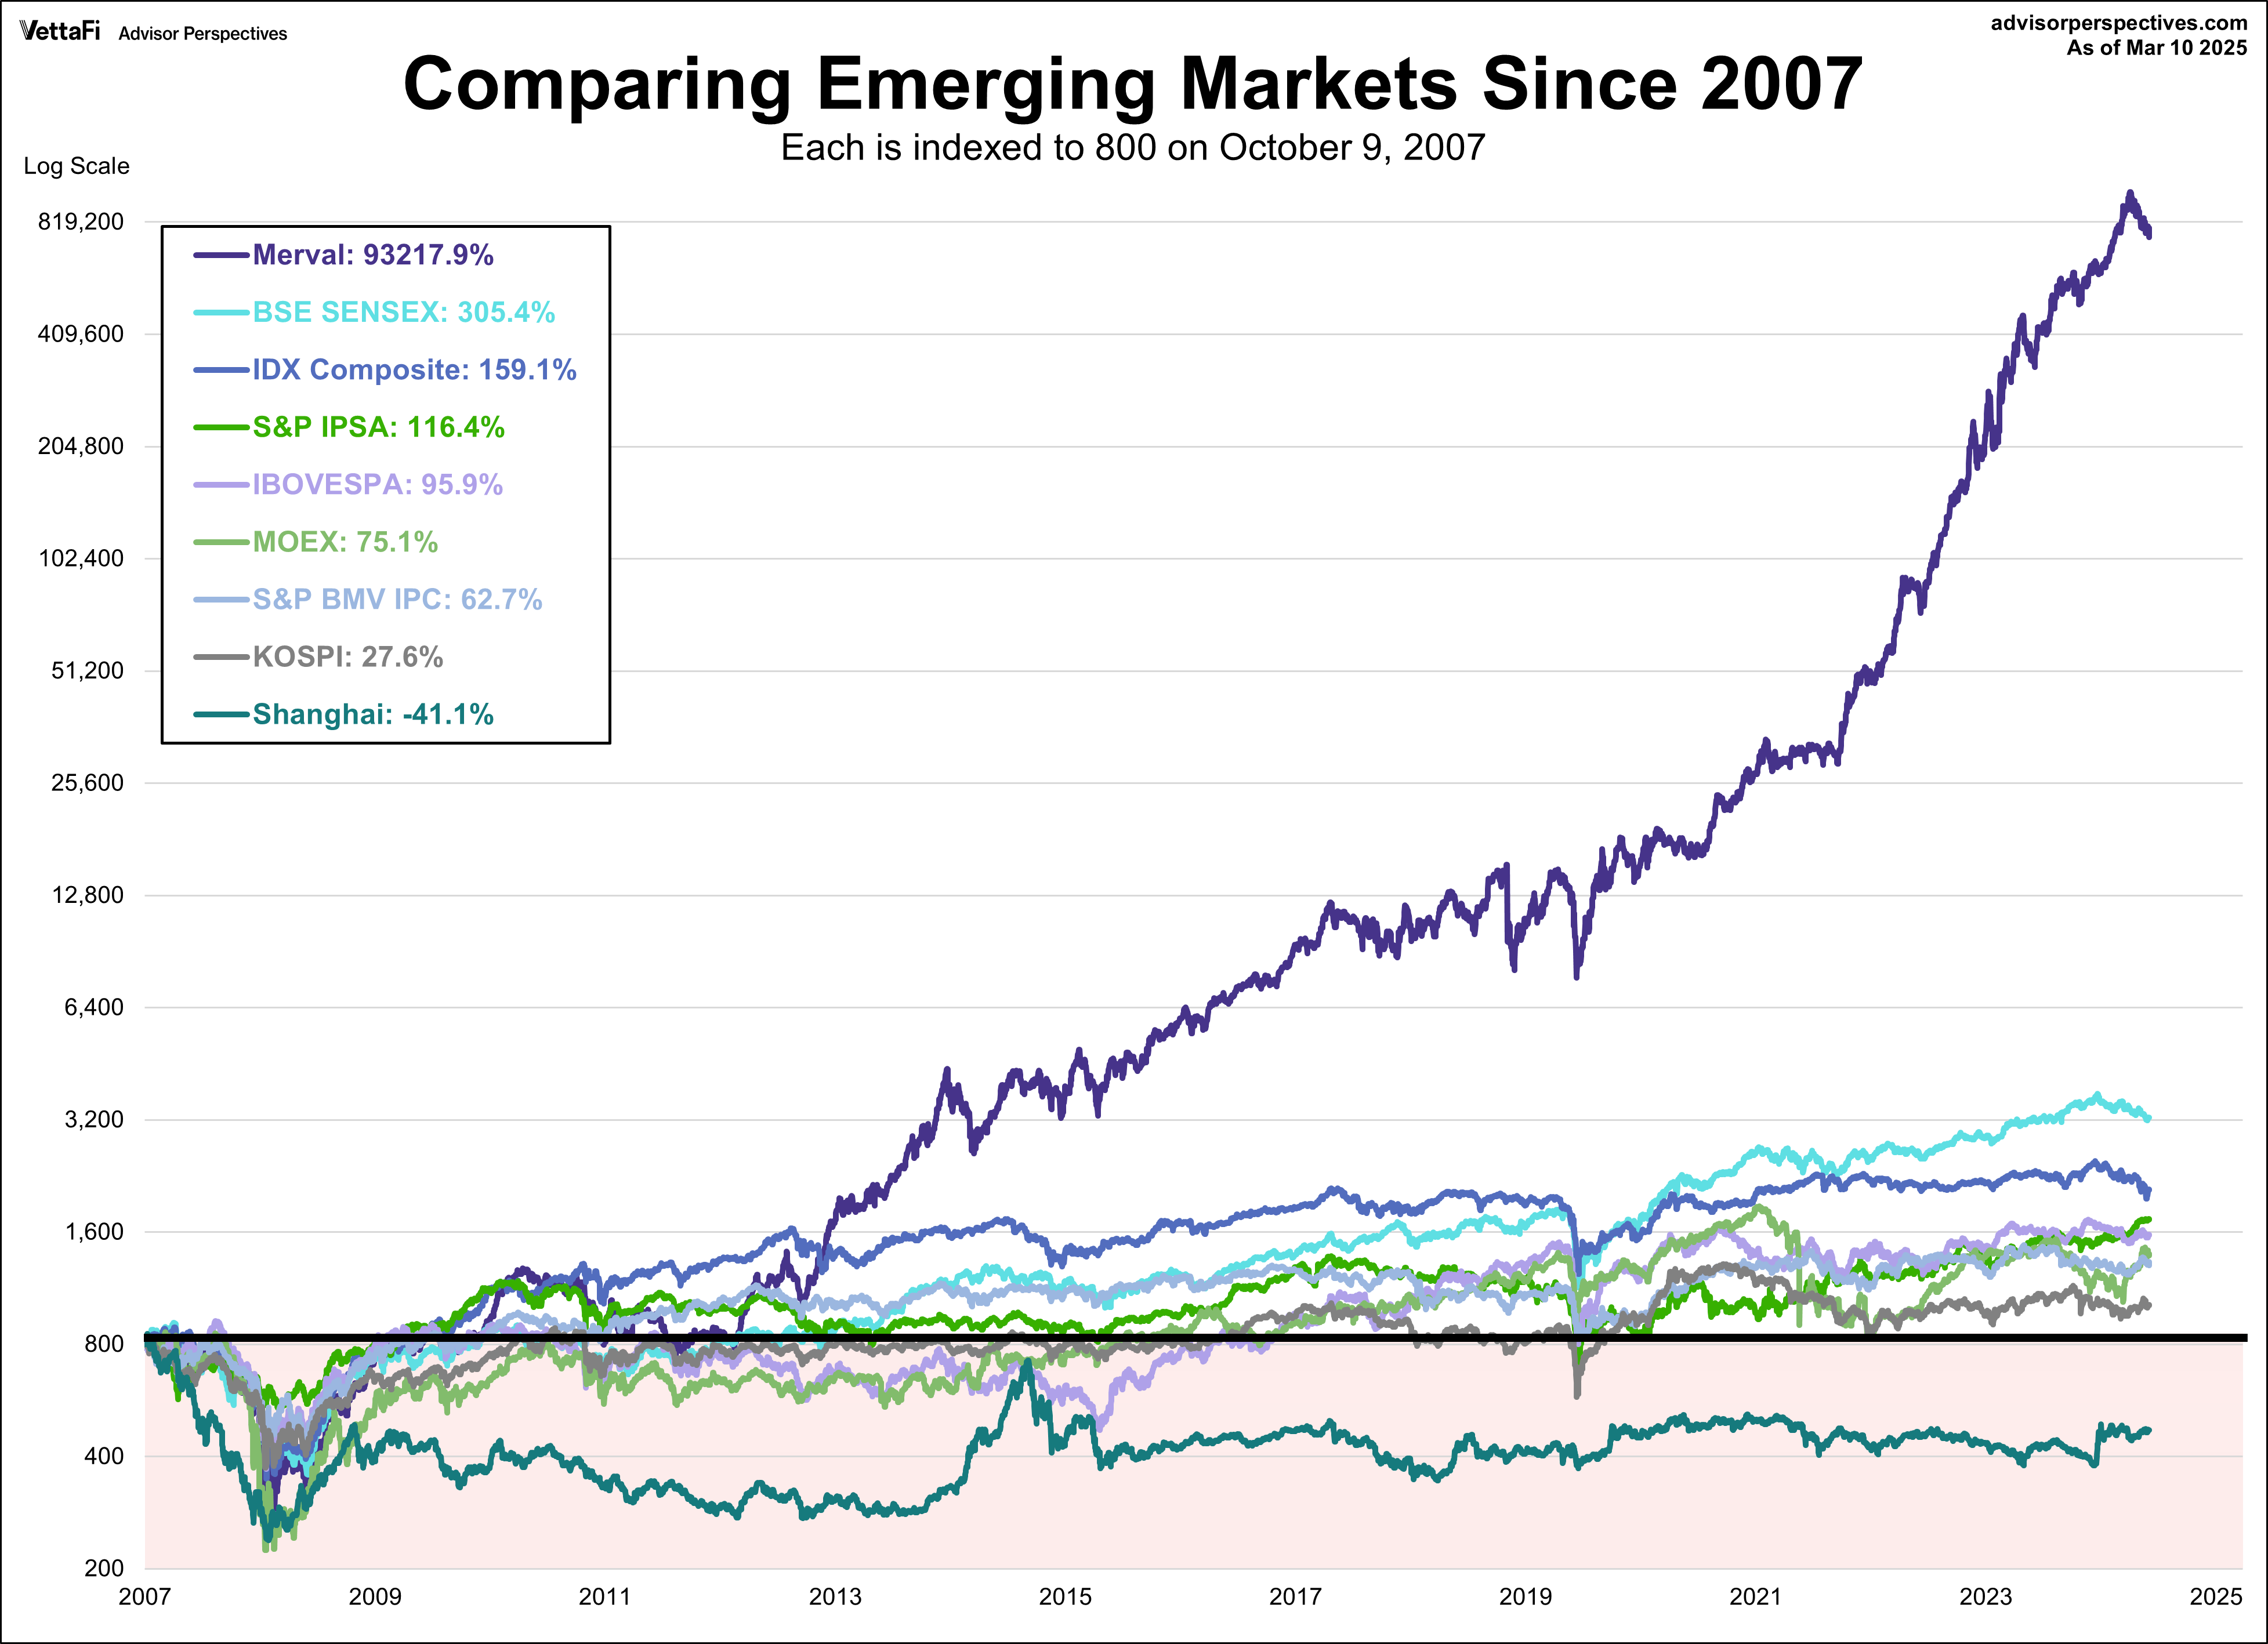
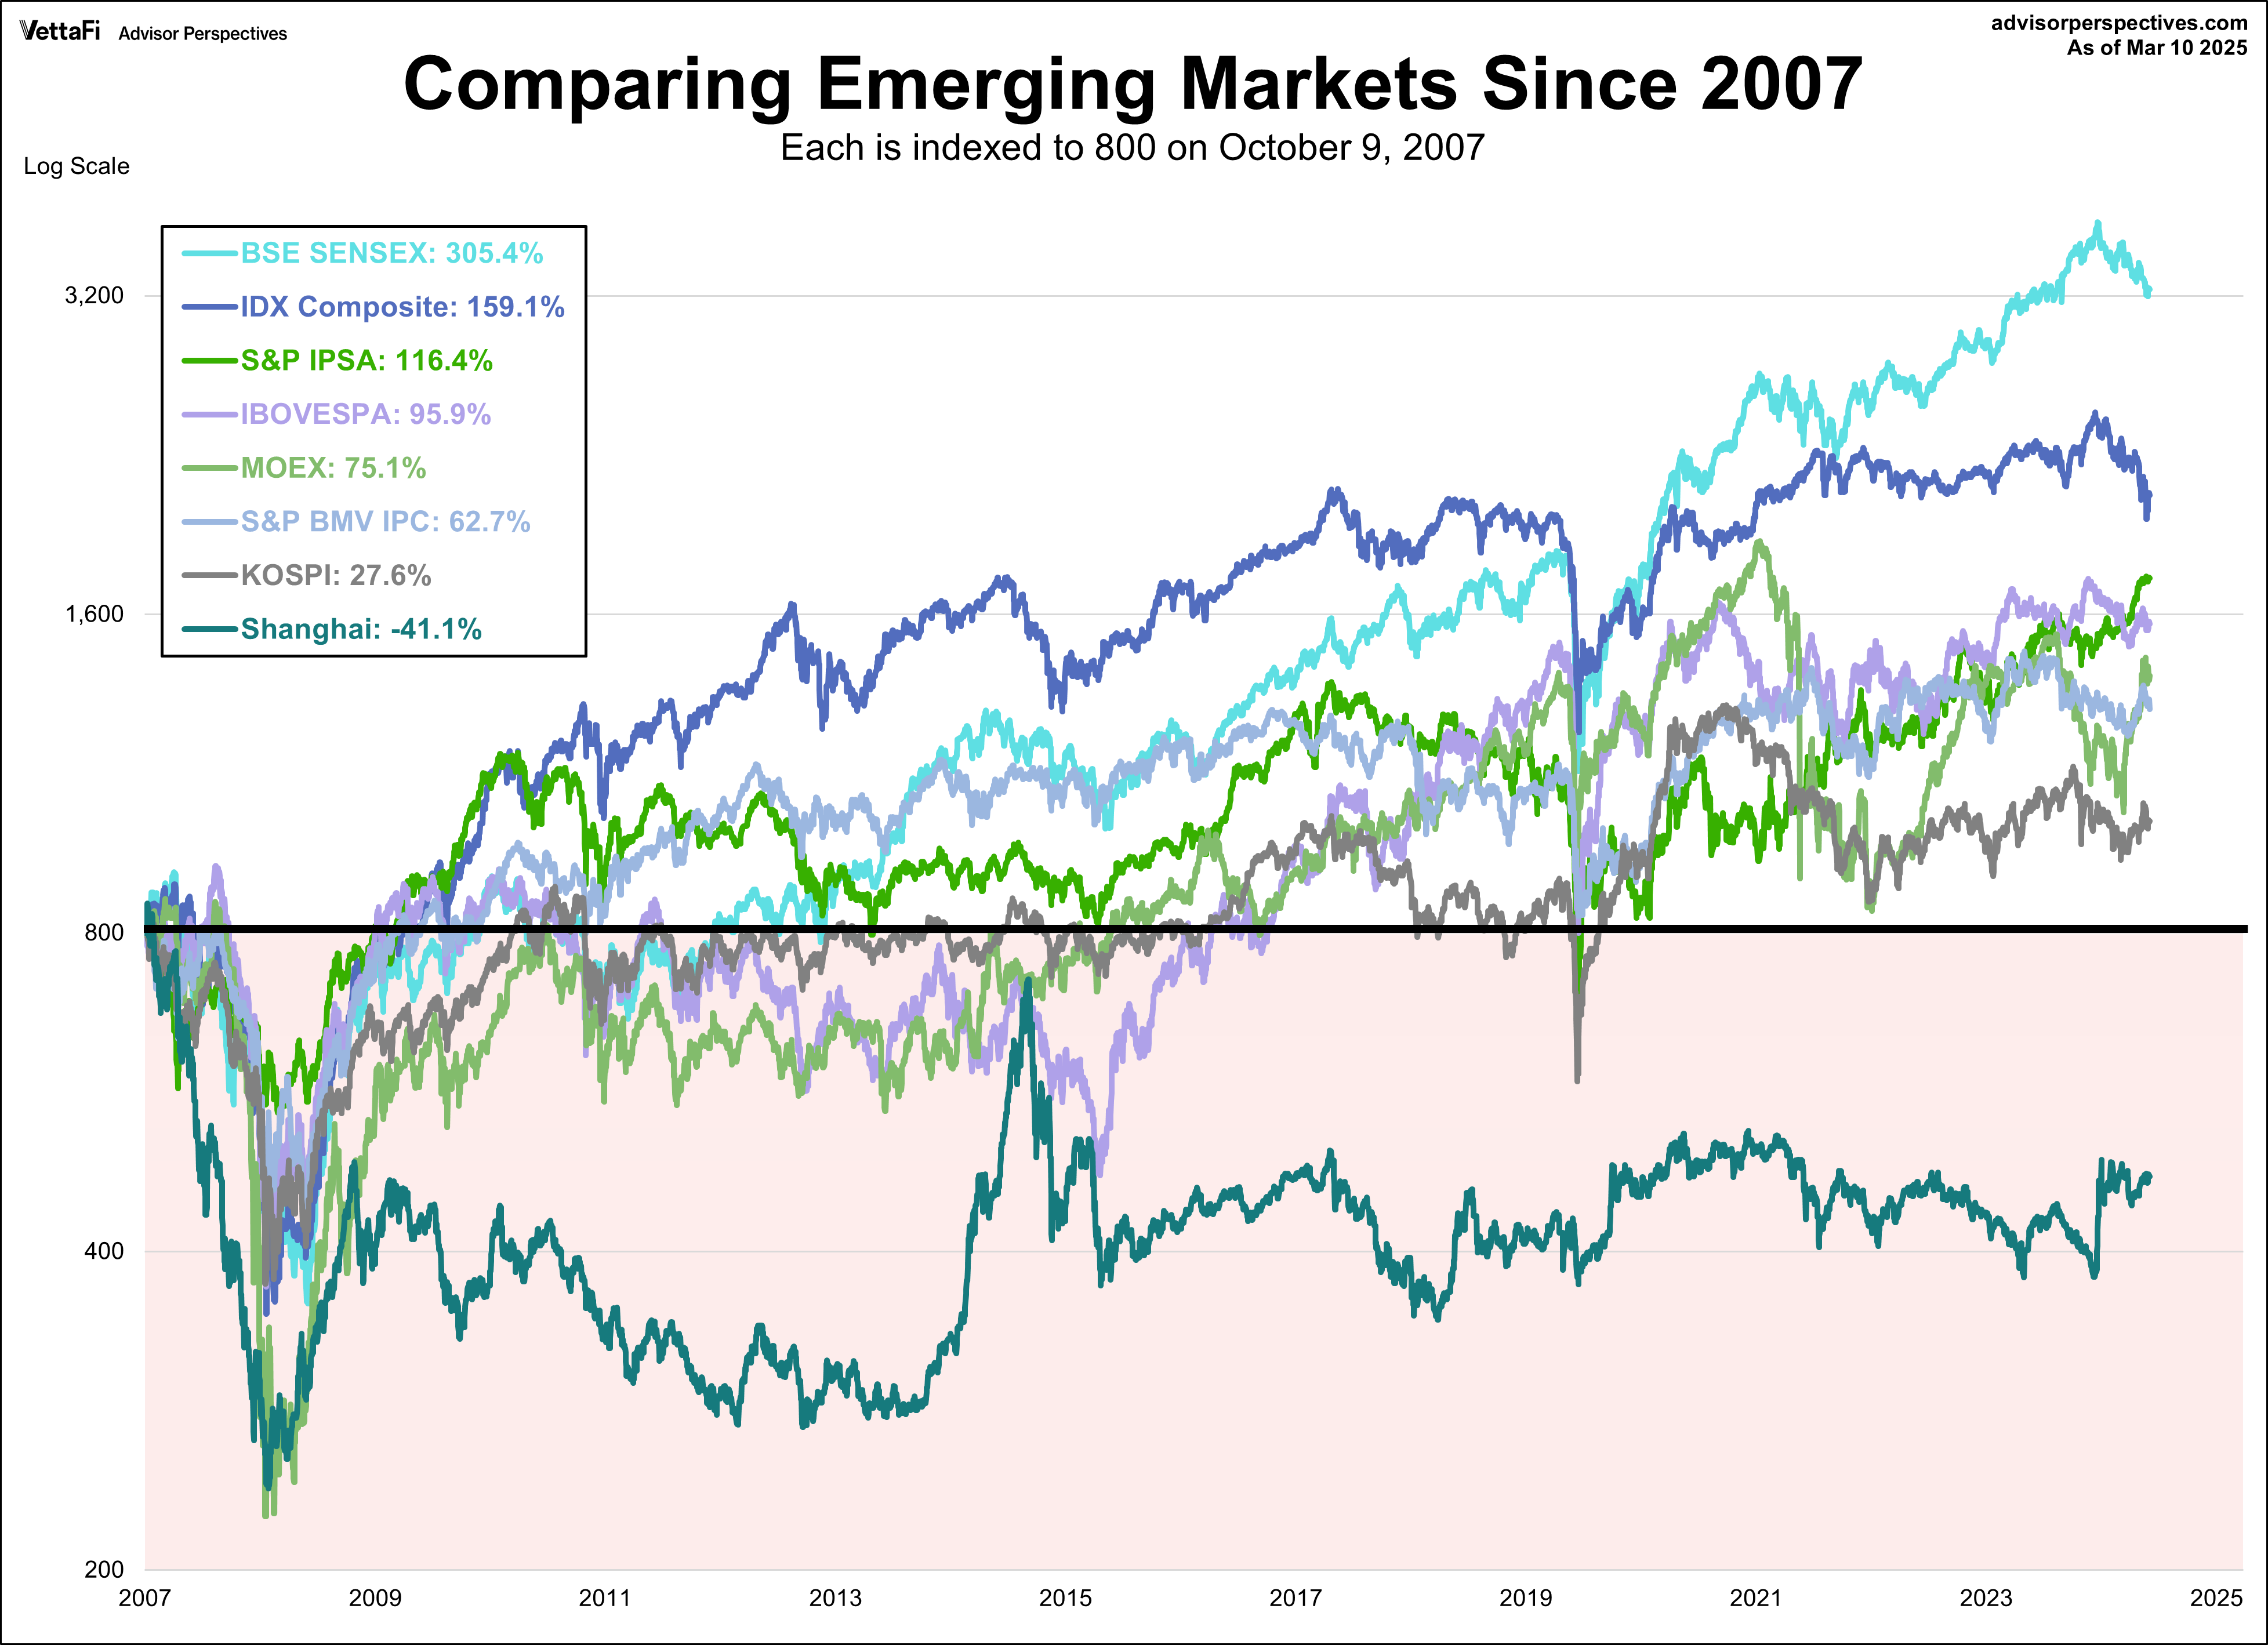
Here is the same visualization, this time starting on October 9, 2007.
 |
 |
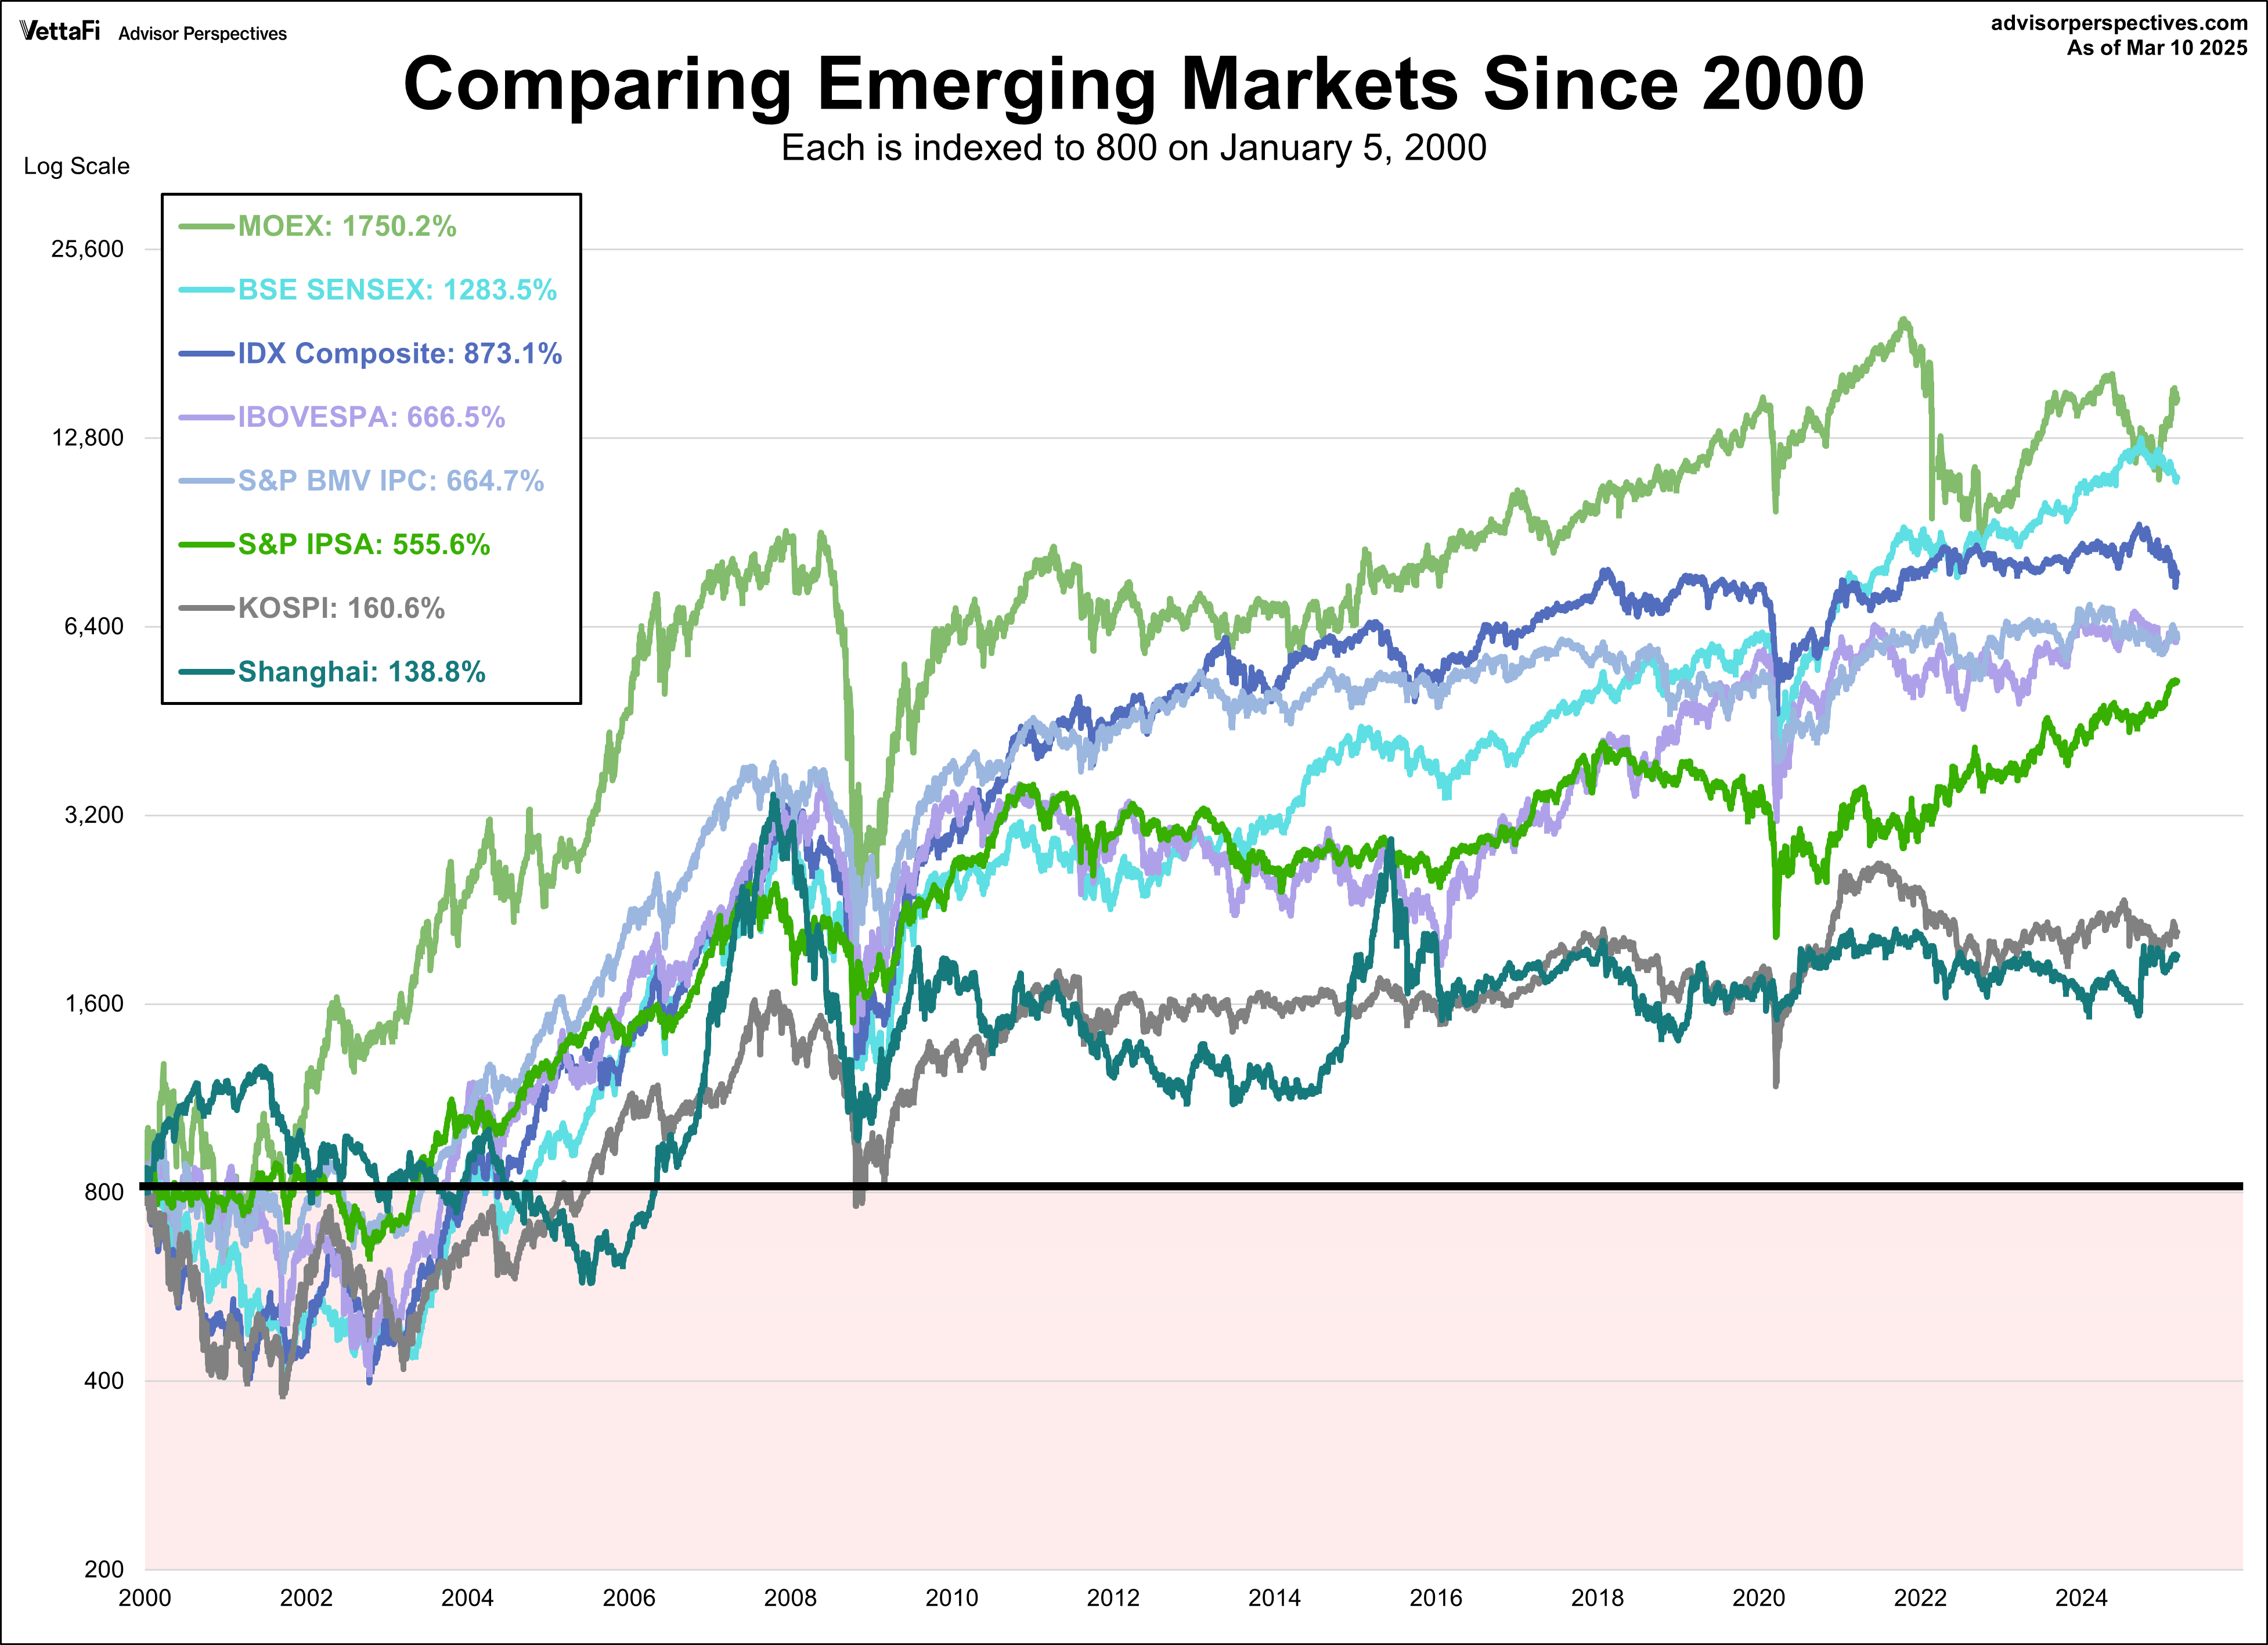
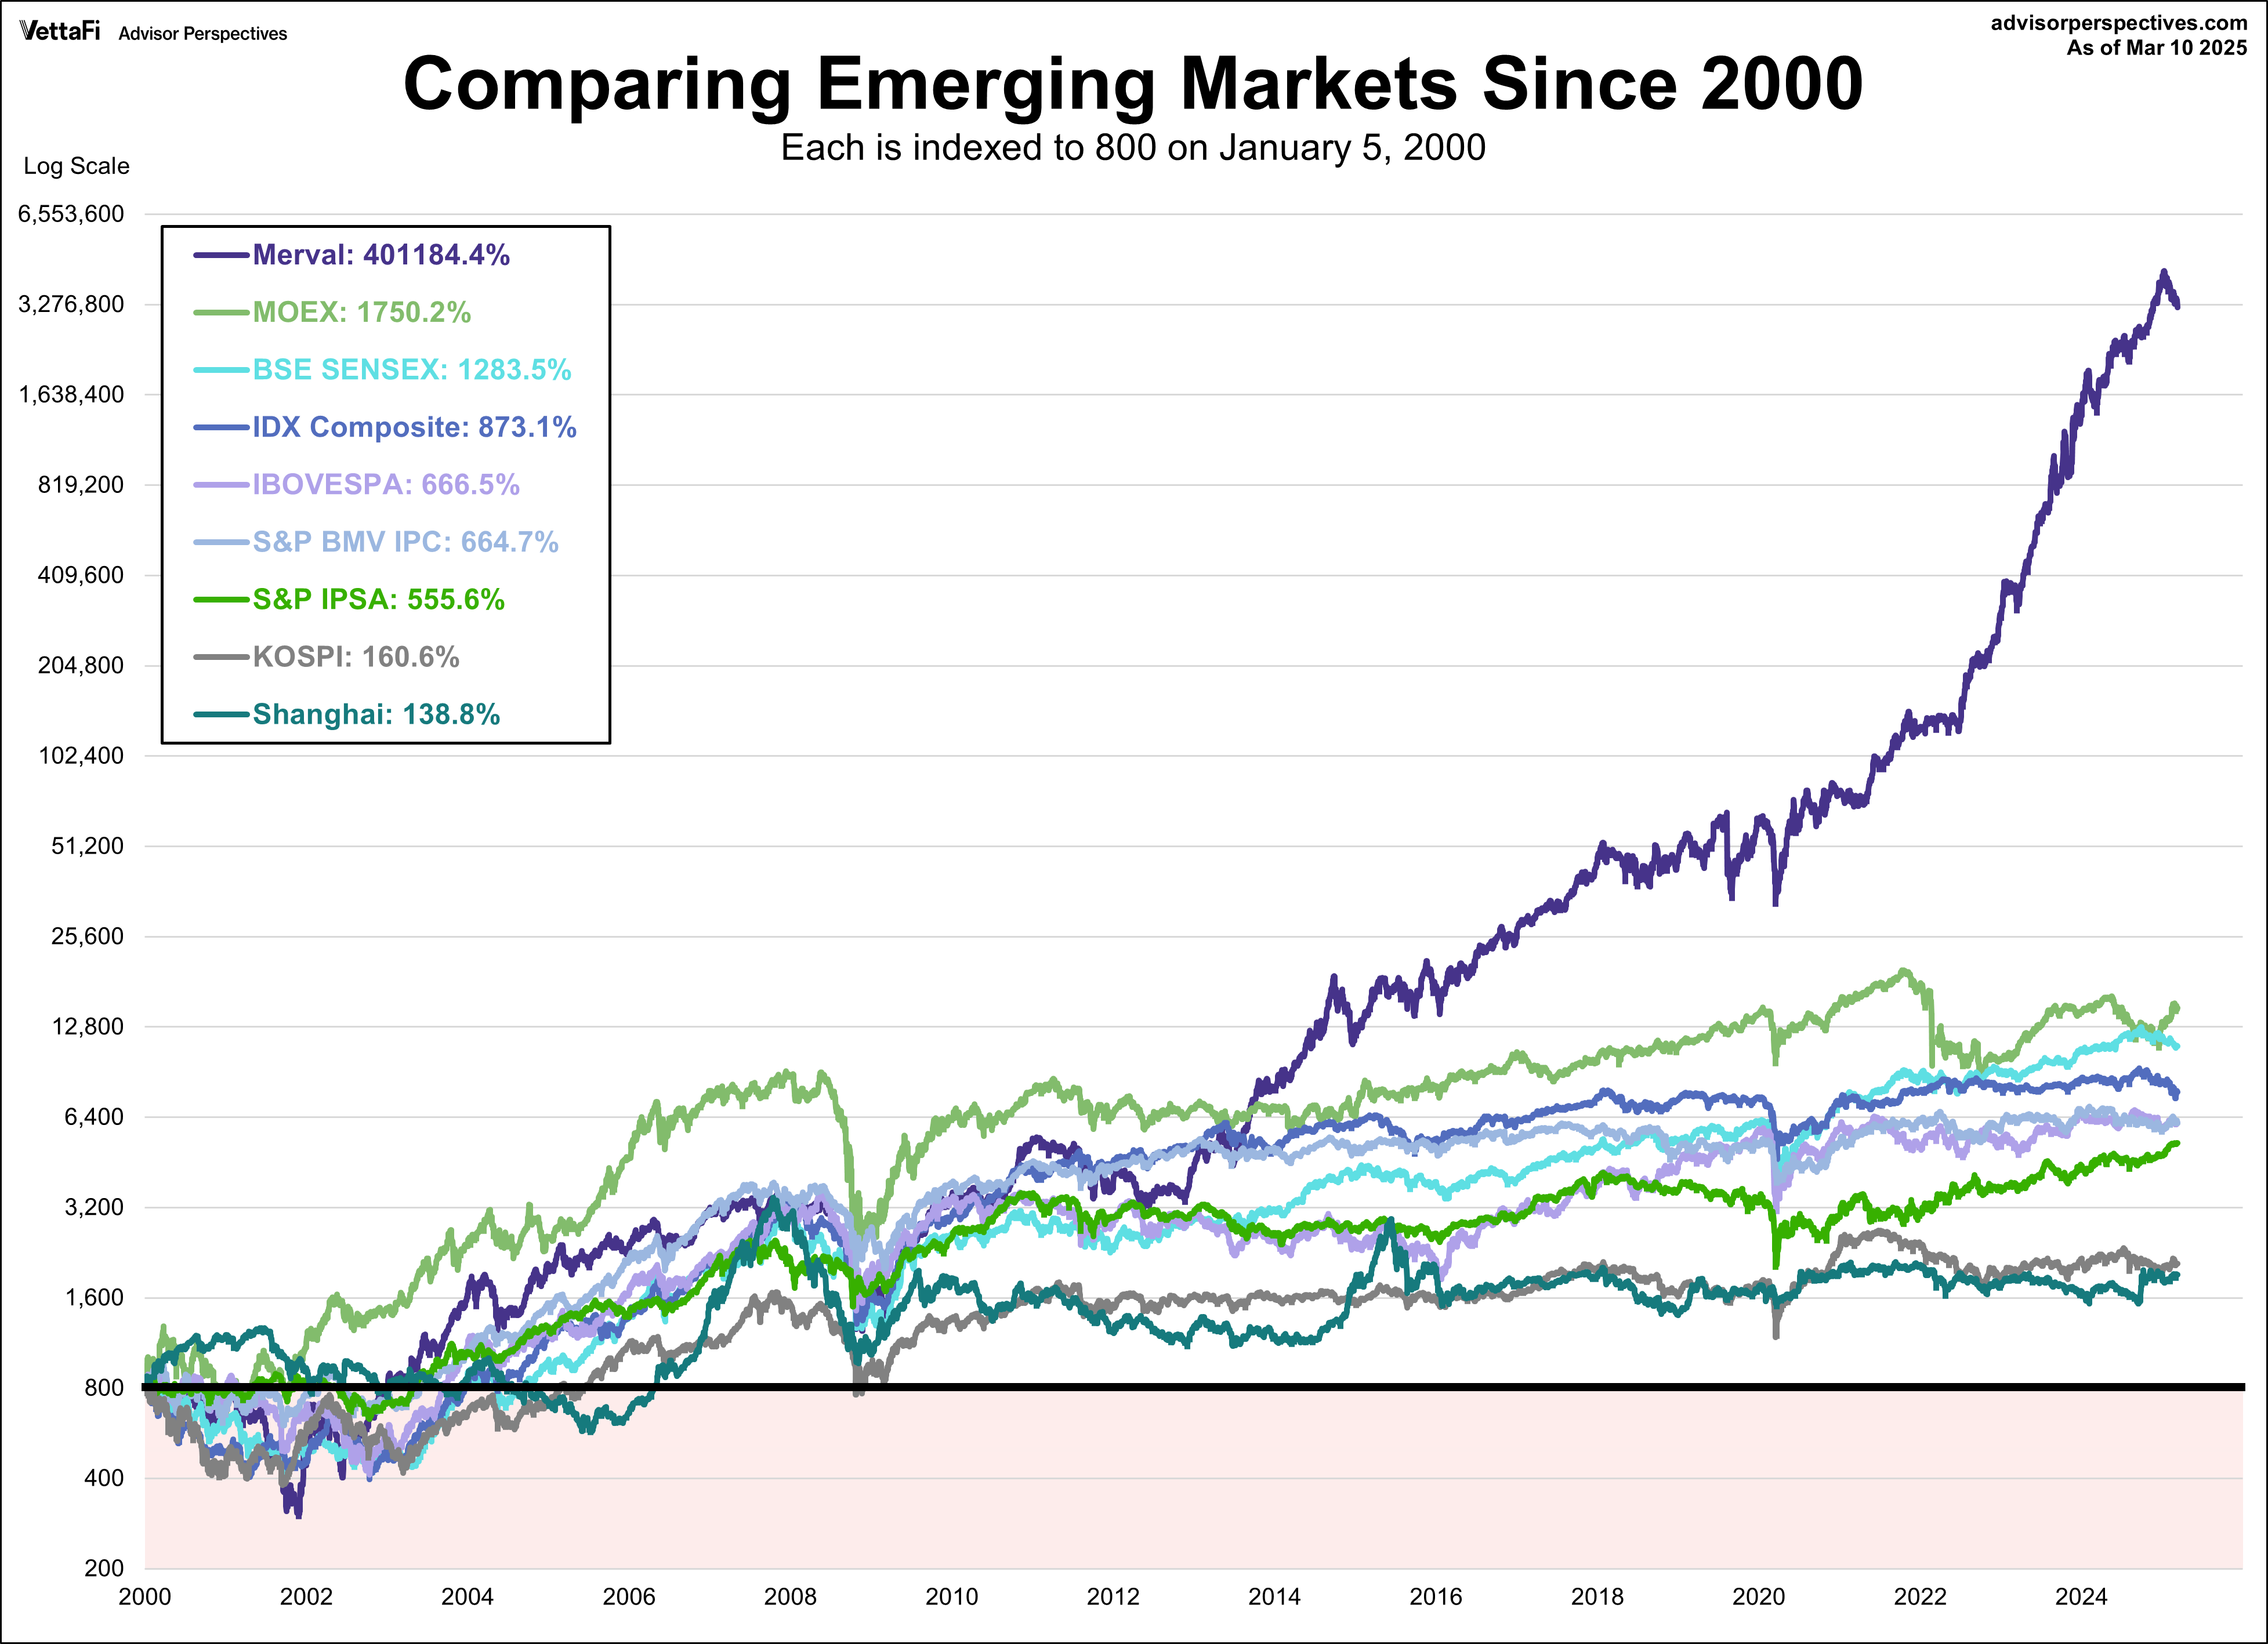
For a longer look at the relative performance, our final chart starts at the turn of the century, again indexing each at 800 for the start date.
 |
 |
Examples of single country ETFs:
- KraneShares CSI China Internet ETF (KWEB)
- iShares MSCI India ETF (INDA)
- iShares MSCI Chile ETF (ECH)
- iShares MSCI South Korea ETF (EWY)
- iShares MSCI Mexico ETF (EWW)
- iShares MSCI Brazil ETF (EWZ)
- iShares MSCI Indonesia ETF (EIDO)
- Global X MSCI Argentina ETF (ARGT)
Originally published on Advisor Perspectives.
For more news, information, and strategy, visit the China Insights Channel.
