From Stanphyl Capital’s letter top investors for the month ended September 30, 2018.
Friends and Fellow Investors:
For September 2018 the fund was up approximately 9.2% net of all fees and expenses. By way of comparison, the S&P 500 was up approximately 0.6% while the Russell 2000 was down approximately 2.4%. Year-to-date the fund is down approximately 9.2% while the S&P 500 is up approximately 10.6% and the Russell 2000 is up approximately 11.5%. Since inception on June 1, 2011 the fund is up approximately 81.5% net while the S&P 500 is up approximately 152.8% and the Russell 2000 is up approximately 121.4%. Since inception the fund has compounded at approximately 8.5% net annually vs 13.5% for the S&P 500 and 11.5% for the Russell 2000. (The S&P and Russell performances are based on their “Total Returns” indices which include reinvested dividends.) As always, investors will receive the fund’s exact performance figures from its outside administrator within a week or two; meanwhile I continue to waive the annual management fee until the entire fund regains its high-water mark.
We’ve now gone through a 21-month spell (since the end of 2016) during which the fund has been “not long enough” and yet at current asset prices I suspect we’ll remain “not long enough” until the point at which many market participants suddenly feel “too long.” Then, when most wallets are closed, ours will open.
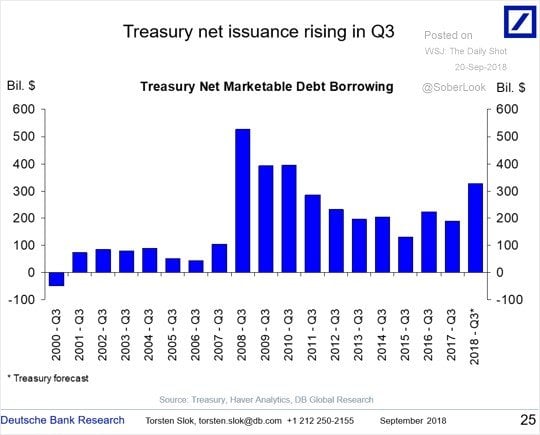
As noted in recent letters, through this entire bull market low interest rates were used to justify egregious earnings multiples on stocks, as well as creating those earnings via cheap mortgages, auto loans, debt-financed stock buybacks, etc., and yet now those rates are now climbing while the liquidity withdrawal of the Fed’s quantitative tightening continues, and in October the ECB will cut its monthly printing from €30 billion to €15 billion and eliminate it entirely in January. (See additional color later in this letter re our BNDX short.) The 10-year U.S. treasury yield has definitively broken its long-term downtrend and now sits at over 3%, at least in part due to a soaring budget deficit…
![]()
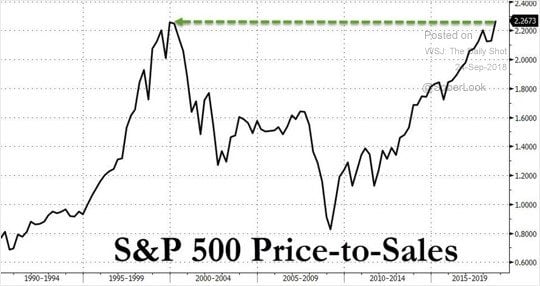
…while the 2-year yield of over 2.8% handily bests the S&P 500’s approximately 1.7%, thereby presenting an attractive alternative to an index priced at over 24x trailing GAAP earnings and a price-to-sales ratio that’s back up to the level of the 2000 bubble…
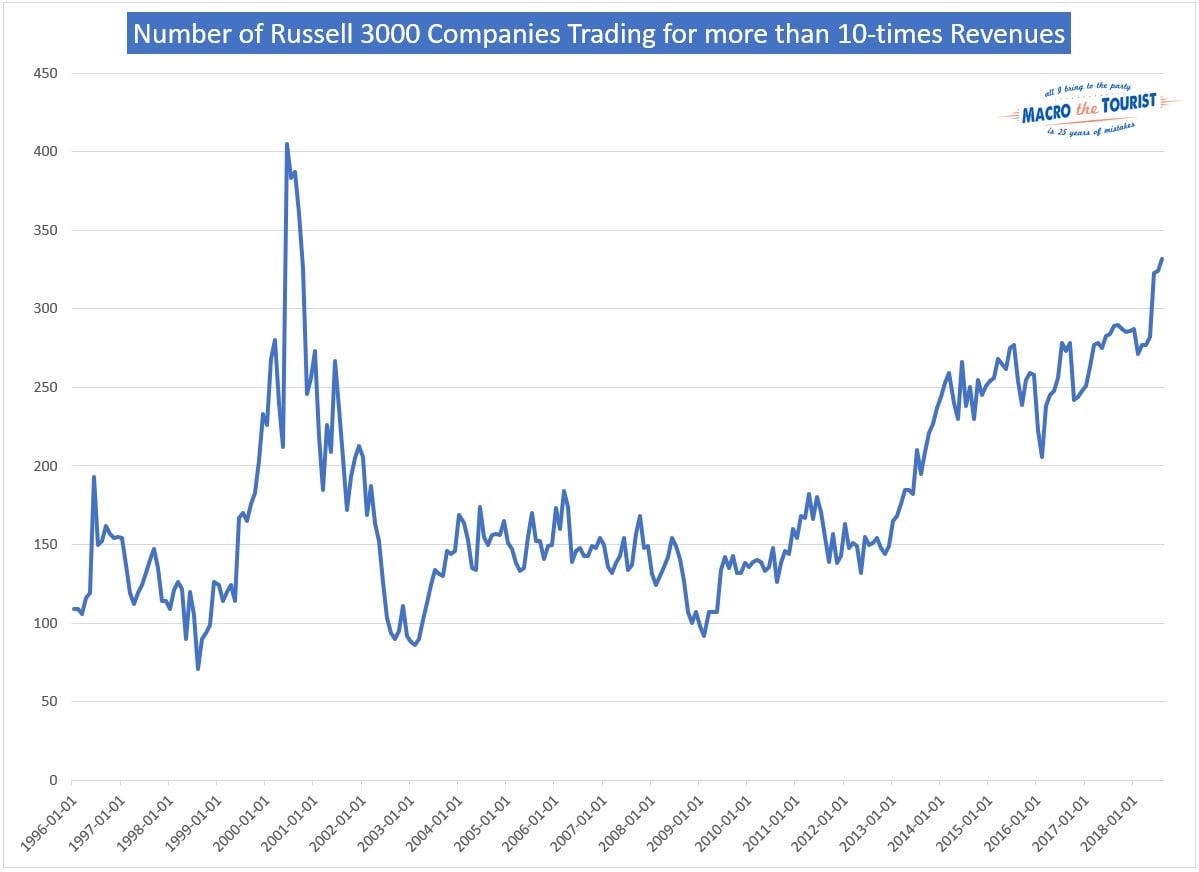
…while the number of Russell 3000 companies trading above 10x revenue is second only to that of the 2000 bubble:
Meanwhile, a nearly flat 2-10 curve which may not need to flatten completely ahead of a recession…
