Uncertainty remains high and concerns about economic strength remain very real. But calls for a look at quality growth are getting louder as we approach the second half of the year.
Up until the April 8 market low, value had been outperforming growth by at least 10 percentage points in 2025 (using Vanguard’s VTV and VUG as proxies). Value had also been delivering stronger results than the S&P 500 early into the year.
But since the April 8 low, that dynamic has changed, and value has underperformed growth notably. There have been many drivers behind this trend, but a largely positive Q1 earnings season for the “Magnificent 7” stocks seems to have reaffirmed it.
As a group, these leading seven high-growth companies reported a Q1 earnings growth rate of 27.7%, according to FactSet data. While these results were below the average growth rate seen in the previous three quarters, they were above market expectations.
As we entered June this week, there remains a lot we don’t know. Tariff policy and impact remain unclear. Soft and hard economic data continue to paint a mixed picture about the economic growth outlook. Geopolitical heat is running hot. Uncertainty remains this year’s prevailing theme. All of this is keeping investors cautious. But since April 8 and post some key Q1 results, growth stocks have found a new footing.
Quality growth has been especially interesting.
What’s Quality Growth?
Quality can be a tricky metric because it lacks a universal single measure. Folks disagree on what it means. But we can say that profitability is a key — if not the key — to quality.
Late last year, I had the opportunity to chat with Professor Robert Novy-Marx, whose research identified the profitability factor. His 2012 paper, “The Other Side of Value: The Gross Profitability Premium,” mainstreamed the concept.
In one excerpt, the paper reads: “Profitability, measured by gross profits-to-assets, has roughly the same power as book-to-market predicting the cross-section of average returns. Profitable firms generate significantly higher returns than unprofitable firms, despite having significantly higher valuation ratios.”
Consider the performance of the VictoryShares Free Cash Flow Growth ETF* (GFLW) versus VUG:
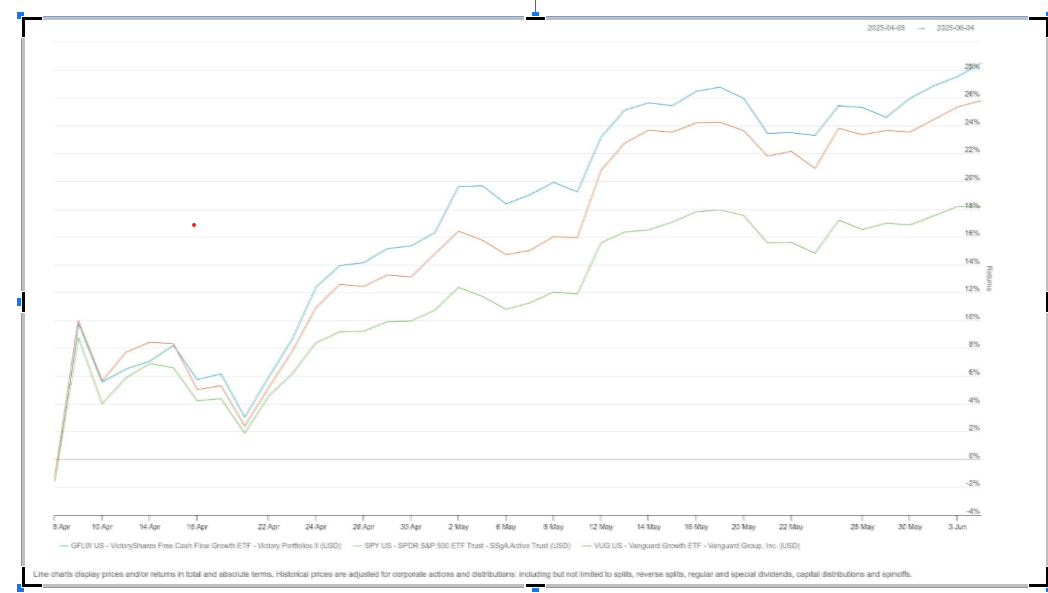 Source: VettaFi PRO
Since April 8, GFLW is up 28% versus 25% for VUG. They both delivered higher results than the S&P 500 (as measured by SPY).
GFLW captures high-quality growth by focusing on profitability and free cash flow. Lance Humphery, head of portfolio management at VictoryShares tells the story of how GFLW came to be. It started with the premise that value outperforms growth over time, so how could it be that growth had been such a hot streak for the past 10-20 years?
As he put it, the data shows that companies with the highest growth rates underperform companies with the lowest growth rates. Even in the past two decades or so when growth indexes have delivered such a punch, that still held true. But how could that be?
“We found that it’s not the growth element of growth indexes [that works]. It’s profitability,” he said in a recent webcast. “What led the Mag 7 to such great results is that they are incredibly profitable. They generate a lot of free cash flow and compound that over time.”
On a risk/return spectrum, growth metrics such as earnings-per-share growth and sales growth offer higher risk, lower return. Quality metrics such as return on equity and gross margin are the opposite. Free cash flow profitability sits highest among quality metrics.
Consider the chart below, shared in a recent webcast (you can watch a replay here.)
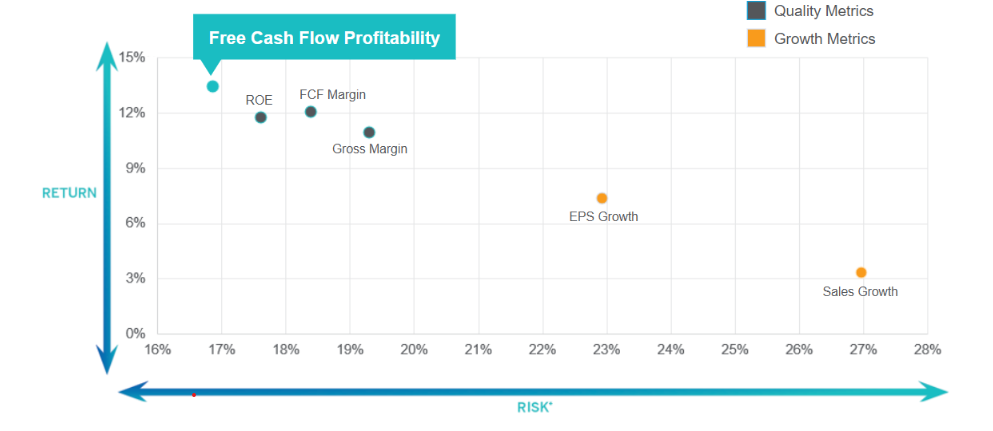
Source: VictoryShares, FactSet Data – Analysis 12-31-99 to 12-31-24.
“GLFW focuses on that source of alpha,” Humphrey said.
A look at the fund’s current top 10 holdings includes well-known growth names like Palantir, Meta, Alphabet, and Nvidia.
GFLW is a young fund, having launched last December, but it already has some $510 million in assets. And it’s not the only interesting ETF looking to capture quality growth.
Quality Factor ETF Plays
The Dimensional US High Profitability ETF (DUHP), in fact, was originally created around Prof. Novy-Marx’s research some three years ago. The methodology detailed in the prospectus states that high profitability is measured as high earnings or profits from operations in relation to a company’s book value or assets. It’s a growth-meets-attractive valuation type of approach that’s anchored on quality as measured by profitability.
DUHP, which holds over 170 stocks, has technology as its top sector exposure currently. Nvidia, Microsoft, and Apple are among top holdings. DUHP is up more than 16% since the April 8 low.
The American Century US Quality Growth ETF (QGRO) captures quality growth with an eye on valuation metrics as well. The strategy selects stocks with higher profitability, return on assets, return on equity, and momentum relative to their peers, according to the prospectus.
Growth metrics such as sales, earnings, and cash flow growth go into creating a growth score for each security, and then valuation considerations such as price to earnings and price to book ratios come into play.
The resulting portfolio, which is up about 25% since April 8, has Meta, Netflix, and Microsoft among top holdings. QGRO, which is six years old, is a $1.6 billion ETF.
Defensive Growth
In the current market environment, where caution and some defensive positioning have been key, quality growth has been delivering an interesting risk-adjusted return profile for investors pursuing growth stocks. Asset flows have been positive across this category.
DUHP has picked up more than $850 million in fresh net assets year-to-date, and more than $350 million in Q2 alone. The still-new GFLW has already captured $420 million in net assets in 2025, and QGRO has net inflows of $435 million.
These funds are just a few of the many in this category, which include strategies from WisdomTree and Hartford Funds, among others. Quality growth may be offering just the right amount of defensive flavor to a risk asset investors are looking for this year.
VettaFi LLC (“VettaFi”) is the index administrator and calculation agent for QGRO and GFLW, for which it receives a fee. However, QGRO and GFLW are not issued, sponsored, endorsed, or sold by VettaFi, and VettaFi has no obligation or liability in connection with the issuance, administration, marketing, or trading of QGRO or GFLW.
For more news, information, and analysis, visit VettaFi | ETF Trends.
