
25 years ago I wrote a book called “Navigate the Noise” that posited people have difficulty building wealth because they often follow a Sirens’ Song of high-returning yet “riskless” assets instead of following time-tested wealth-building principles. Continuing the Greek mythology theme, investors’ portfolios that steer toward the hauntingly attractive story of “riskless” high-returning assets eventually “crash on the rocks.”
The Sirens’ have been singing loudly and investors are again refusing to follow sound wealth-building strategies, like diversification. Many investors today believe diversification has become “diWORSEsification”. They question the purpose to diversification when all one needed to do was trade a small group of surging stocks, i.e., the Sirens’ luring combination of high returns with no risk. Buying other assets, they felt, just added risk to a portfolio and hindered performance.
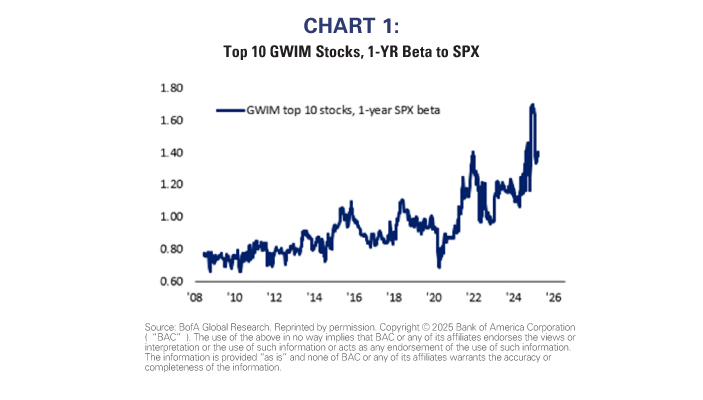
Perhaps the best example of portfolios being steered off-course is the beta of private client portfolios. At the end of January, private client investors’ largest stock holdings had an aggregate beta of an absolutely mind-boggling 1.7 (1.0 implies risk equal to the overall equity market’s risk within the context of a well-diversified portfolio). As Chart 1 highlights, that beta decreased as market volatility picked up, but investors nonetheless have started to increase portfolio beta again.
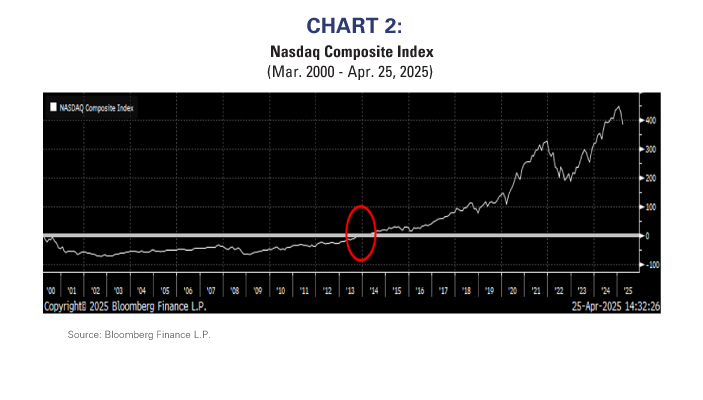
Such fervor has historically been a sign that future returns might be subpar. For example, it took NASDAQ more than a decade simply to break even after the peak of the Technology Bubble in March 2000 despite widespread adoption of the internet over that period (see Chart 2).
Large Cap Growth isn’t riskless!
Traditional risk/return analyses demonstrate today’s potential folly of believing that investing in Large Capitalization Growth stocks is a sure and safe way to invest. In fact, there are many asset classes that have shown equal and even better risk/return characteristics than Large Cap Growth.
Chart 3 is a risk/return chart based on standard deviation as a measure of risk. The upper left chart examines traditional 1-year risk/return of various asset classes, whereas the other three incorporate 3, 5, and 10-year holding periods.
Using this definition of risk under various time horizons, Large Cap Growth does provide relatively high returns, but it is actually a very risky category. The 10-year chart is perhaps most interesting because it highlights that many asset classes and sub-asset classes have historically provided similar returns to Large Cap Growth, but with varying degrees of reduced risk. Lower Quality stocks, Small Cap Value, REITs, a diversified quality basket (noted as “A+”), EM Sovereign Debt, and even an S&P 500® Index Fund provide similar long-term returns with less volatility.
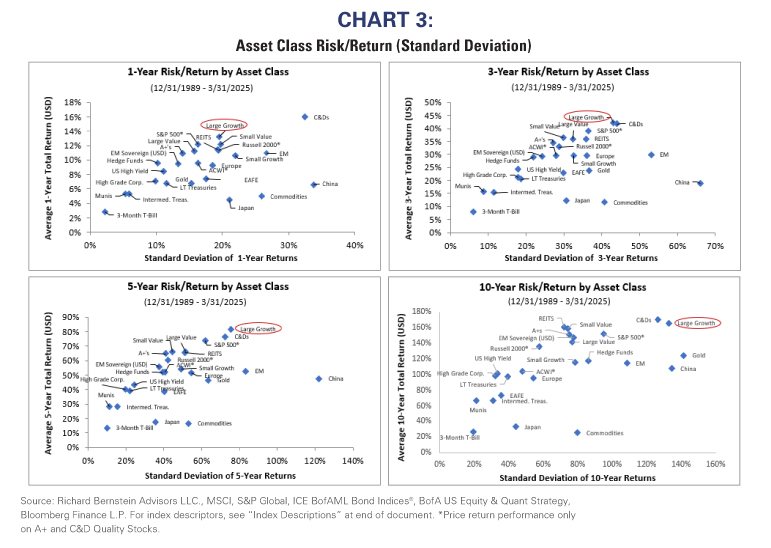
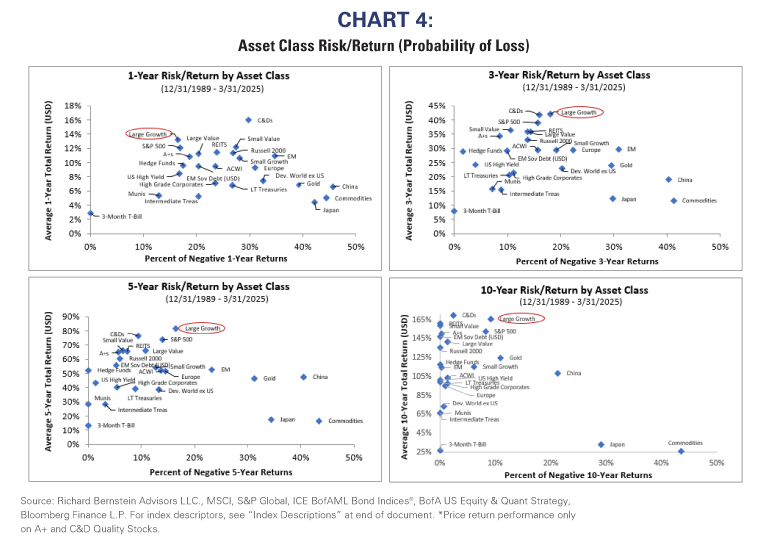
Chart 4 is a similar set of risk/return analyses that defines risk as the probability of losing money rather than as the standard deviation of returns. Using this definition, Large Cap Growth has historically looked attractive on a one-year risk/return basis, but again that attractiveness dissipates as one incorporates longer time horizons.
Many academics have noted that “bad companies can make good stocks” and that conclusion is indeed supported by these charts. C&D-ranked stocks (i.e., those with considerable volatility and slower growth in earnings and dividends) have superior historical risk/return statistics in many of the charts versus Large Cap Growth.
Diversification is key but watch out for the cycle
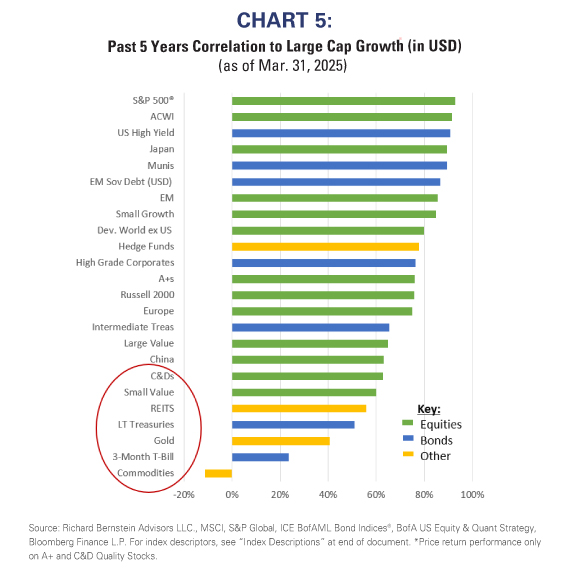
Interestingly, some of the asset classes that provided similar or better long-term risk/return characteristics than Large Cap Growth are also those that have had relatively lower correlations to the asset class. In other words, they are perhaps the good diversifiers to a Large Cap Growth-dominated portfolio.
Chart 5 shows asset class and sub-asset class correlations to Large Cap Growth. Lower Quality stocks, Small Value, REITs, Fixed-Income, and Commodities all seem to offer meaningful diversification versus a Large Cap Growth portfolio.
Some of these diversifying equity assets are highly cyclical and might offer diversification, but they might not offer traditional defensiveness within a portfolio. We see the profits cycle potentially peaking during 2025 and have accordingly been reducing exposure to some of these equity categories. However, cyclical underperformance might offer buying opportunities for longer-term diversification.
RBA’s portfolios continue to focus on fundamentals and not the Sirens’ Song
In Greek mythology, Ulysses wanted to listen to the Sirens’ Song, but he realized he might act irrationally if he did. He put wax in his crew’s ears so they couldn’t hear the alluring melody and had the crew tie him to the mast of his ship so that he could not jump into the sea. Those prudent precautions allowed them to successfully navigate the dangerous waters.
At RBA, our disciplined process serves to keep us from listening to the Sirens and irrationally ignoring the basic building blocks of wealth building. Profits, liquidity, sentiment/valuation, and not the hyped growth story of the day, are the cornerstones of our diversified portfolios.
Originally published April 30, 2025
For more news, information, and strategy, visit the ETF Strategist Channel.
INDEX DESCRIPTIONS:
The following descriptions, while believed to be accurate, are in some cases abbreviated versions of more detailed or comprehensive definitions available from the sponsors or originators of the respective indices. Anyone interested in such further details is free to consult each such sponsor’s or originator’s website.
The past performance of an index is not a guarantee of future results.
Each index reflects an unmanaged universe of securities without any deduction for advisory fees or other expenses that would reduce actual returns, as well as the reinvestment of all income and dividends. An actual investment in the securities included in the index would require an investor to incur transaction costs, which would lower the performance results. Indices are not actively managed and investors cannot invest directly in the indices.
S&P 500®: The S&P 500® Index is an unmanaged, capitalization-weighted index designed to measure the performance of the broad US market. The index includes 500 leading companies covering approximately 80% of available market capitalization.
Small Caps: Russell 2000 Index. The Russell 2000 Index is an unmanaged, market-capitalization-weighted index designed to measure the performance of the small-cap segment of the US equity universe. The Russell 2000 Index is a subset of the Russell 3000® Index.
Nasdaq: The Nasdaq Composite Index: The NASDAQ Composite Index is a broad- based market-capitalization-weighted index of stocks that includes all domestic and international based common type stocks listed on The NASDAQ Stock Market.
Large Growth: Russell 1000 Growth Index. The Russell 1000 Growth Index measures the performance of those Russell 1000 companies with higher price-to- book ratios and higher forecasted growth values. The index was developed with a base value of 200 as of August 31, 1992.
Large Value: Russell 1000 Value Index. The Russell 1000 Value Index measures the performance of those Russell 1000 companies with lower price-to-book ratios and lower forecasted growth values. The index was developed with a base value of 200 as of August 31, 1992.
Small Growth: Russell 2000 Growth Index. The Russell 2000 Growth Index measures the performance of those Russell 2000 companies with higher price-to- book ratios and higher forecasted growth values.
Small Value: Russell 2000 Value Index. The Russell 2000 Value Index measures the performance of those Russell 2000 companies with lower price-to-book ratios and lower forecasted growth values.
A+s (High Quality): The BofA A+ Quality Index: BofA Quality indices: each month BofA groups all of the stocks in the BofA US research coverage universe based
on their Standard and Poor’s quality ranking. The returns are calculated based on the subsequent months’ average price return of each group assuming monthly rebalancing.
C&Ds (Low Quality): The BofA C&D Quality Index: BofA Quality indices: each month BofA groups all of the stocks in the BofA US research coverage universe based on their Standard and Poor’s quality ranking. The returns are calculated based on the subsequent months’ average price return of each group assuming monthly rebalancing.
ACWI: MSCI All Country World Index (ACWI®). The MSCI ACWI® is a free-float- adjusted, market-capitalization-weighted index designed to measure the equity- market performance of global developed and emerging markets.
Developed World ex US: MSCI Developed World ex USA Index. The MSCI Developed World ex USA Index is a free-float-adjusted, market-capitalization- weighted index designed to measure the equity-market performance of global developed markets excluding the USA.
EM: MSCI Emerging Markets (EM) Index. The MSCI EM Index is a free-float- adjusted, market-capitalization-weighted index designed to measure the equity- market performance of emerging markets.
Europe: MSCI Europe Index. The MSCI Europe Index is a free-float-adjusted, market-capitalization-weighted index designed to measure the equity-market performance of developed European markets.
Japan: MSCI Japan Index. The MSCI Japan Index is a free-float-adjusted, market- capitalization-weighted index designed to measure the equity-market performance of Japan.
China: MSCI China Index. The MSCI China Index is a free-float-adjusted, market- capitalization-weighted index designed to measure the equity-market performance of China.
Hedge Funds: HFRI Fund Weighted Composite Index. The HFRI Fund Weighted Composite Index is a global, equal-weighted index of over 2,000 single-manager funds that report to the HFR (Hedge Fund Research) database. Constituent
funds report monthly net-of-all-fees performance in USD and have a minimum of $50 million under management or a twelve (12)-month track record of active
performance. The Index includes both domestic (US) and offshore funds, and does not include any funds of funds.
Gold: Gold Spot USD/oz Bloomberg GOLDS Commodity. The Gold Spot price is quoted as US Dollars per Troy Ounce.
Commodities: The S&P GSCI Total Return CME. The S&P GSCI Total Return Index in USD is widely recognized as the leading measure of general commodity price movements and inflation in the world economy. Index is calculated primarily on a world production weighted basis, comprised of the principal physical commodities futures contracts.
Cash: 3-Mo T-Bills: ICE® BofAML 3-Month US Treasury Bill Index. The ICE® BofA Merrill Lynch 3-Month US Treasury Bill Index is comprised of a single issue purchased at the beginning of the month and held for a full month. The Index is rebalanced monthly and the issue selected is the outstanding Treasury Bill that matures closest to, but not beyond, three months from the rebalancing date.
Long-term Treasury Index: ICE® BofAML 15+ Year US Treasury Index. The ICE® BofA Merrill Lynch 15+ Year US Treasury Index is an unmanaged index comprised of US Treasury securities, other than inflation-protected securities and STRIPS, with at least $1 billion in outstanding face value and a remaining term to final maturity of at least 15 years.
U.S. High Yield: ICE® BofAML US Cash Pay High Yield Index. The ICE® BofA Merrill Lynch US Cash Pay High Yield Index tracks the performance of USD- denominated, below-investment-grade-rated corporate debt, currently in a coupon-paying period, that is publicly issued in the US domestic market. Qualifying securities must have a below-investment-grade rating (based on an average of Moody’s, S&P and Fitch) and an investment-grade-rated country of risk (based on an average of Moody’s, S&P and Fitch foreign currency long-term sovereign debt ratings), at least one year remaining term to final maturity, a fixed coupon schedule, and a minimum amount outstanding of $100 million.
Munis: ICE® BofAML US Municipal Securities Index. The ICE® BofA Merrill Lynch US Municipal Securities Index tracks the performance of USD-denominated, investment-grade rated, tax-exempt debt publicly issued by US states and territories (and their political subdivisions) in the US domestic market. Qualifying securities must have at least one year remaining term to final maturity, a fixed coupon schedule, and an investment-grade rating (based on an average of Moody’s, S&P and Fitch). Minimum size requirements vary based on the initial term to final maturity at the time of issuance.
Intermediate Treasuries (5-7 Yrs): The ICE® BofAML 5-7 Year US Treasury Index. The ICE® BofA Merrill Lynch 5-7 Year US Treasury Index is a subset of The BofA Merrill Lynch US Treasury Index (an unmanaged Index which tracks the performance of US dollar denominated sovereign debt publicly issued by the US government in its domestic market). Qualifying securities must have at least one year remaining term to final maturity, a fixed coupon schedule and a minimum amount outstanding of $1 billion. including all securities with a remaining term to final maturity greater than or equal to 5 years and less than 7 years.
High Grade Corporates: ICE® BofAML 15+ Year AAA-AA US Corporate Index. The ICE® BofA Merrill Lynch 15+ Year AAA-AA US Corporate Index is a subset of ICE® BofA Merrill Lynch US Corporate Index (an unmanaged index comprised of USD- denominated, investment-grade, fixed-rate corporate debt securities publicly issued in the US domestic market with at least one year remaining term to final maturity and at least $250 million outstanding) including all securities with a remaining term to final maturity of at least15 years and rated AAA through AA3, inclusive.
EM Sovereign: ICE® BofAML US Dollar Emerging Markets Sovereign Plus Index. The ICE® BofA Merrill Lynch US Dollar Emerging Markets Sovereign Plus Index tracks the performance of US dollar denominated emerging market and cross-over sovereign debt publicly issued in the Eurobond or US domestic market. Qualifying countries must have a BBB1 or lower foreign currency long-term sovereign debt rating (based on an average of Moody’s, S&P and Fitch). Countries that are not rated, or that are rated “D” or “SD” by one or several rating agencies qualify for inclusion in the index but individual non-performing securities are removed. Qualifying securities must have at least one year remaining term to final maturity, a fixed or floating coupon and a minimum amount outstanding of $250 million. Local currency debt is excluded from the Index.
About Richard Bernstein Advisors
Richard Bernstein Advisors LLC is an investment manager focusing on long-only, global equity and asset allocation investment strategies. RBA runs ETF asset allocation SMA portfolios at leading wirehouses, independent broker/dealers, TAMPS and on select RIA platforms.
Additionally, RBA partners with several firms including Eaton Vance Corporation and First Trust Portfolios LP, and currently has $15.7 billion collectively under management and advisement as of March 31, 2025. RBA acts as sub‐advisor for the Eaton Vance RBA Equity Strategy Fund, the Eaton Vance RBA All‐Asset Strategy Fund and also offers income and unique theme‐oriented unit trusts through First Trust. RBA is also the index provider for the First Trust RBA American Industrial Renaissance® ETF. RBA’s investment insights as well as further information about the firm and products can be found at www. RBAdvisors.com.
Nothing contained herein constitutes tax, legal, insurance or investment advice, or the recommendation of or an offer to sell, or the solicitation of an offer to buy or invest in any investment product, vehicle, service or instrument. Such an offer or solicitation may only be made by delivery
to a prospective investor of formal offering materials, including subscription or account documents or forms, which include detailed discussions of the terms of the respective product, vehicle, service or instrument, including the principal risk factors that might impact such a purchase or investment, and which should be reviewed carefully by any such investor before making the decision to invest. RBA information may include statements concerning financial market trends and/or individual stocks, and are based on current market conditions, which will fluctuate and may be superseded
by subsequent market events or for other reasons. Historic market trends are not reliable indicators of actual future market behavior or future performance of any particular investment which may differ materially, and should not be relied upon as such. The investment strategy and broad themes discussed herein may be inappropriate for investors depending on their specific investment objectives and financial situation. Information contained in the material has been obtained from sources believed to be reliable, but not guaranteed. You should note that the materials are provided “as is” without any express or implied warranties. Past performance is not a guarantee of future results. All investments involve a degree of risk, including the risk of loss. No part of
RBA’s materials may be reproduced in any form, or referred to in any other publication, without express written permission from RBA. Links to appearances and articles by employees of Richard Bernstein Advisors, whether in the press, on television or otherwise, are provided for informational purposes only and in no way should be considered a recommendation of any particular investment product, vehicle, service or instrument or the rendering of investment advice, which must always be evaluated by a prospective investor in consultation with his or her own financial adviser and in light of his or her own circumstances, including the investor’s investment horizon, appetite for risk, and ability to withstand a potential loss of some or all of an investment’s value. Graphs, charts,
and tables are provided for illustrative purposes only. Investing is subject to market risks. Investors acknowledge and accept the potential loss of some or all of an investment’s value. Views represented are subject to change at the sole discretion of Richard Bernstein Advisors LLC. Richard Bernstein Advisors LLC does not undertake to advise you of any changes in the views expressed herein.
© Copyright 2025 Richard Bernstein Advisors LLC. All rights reserved. PAST PERFORMANCE IS NO GUARANTEE OF FUTURE RESULTS
