
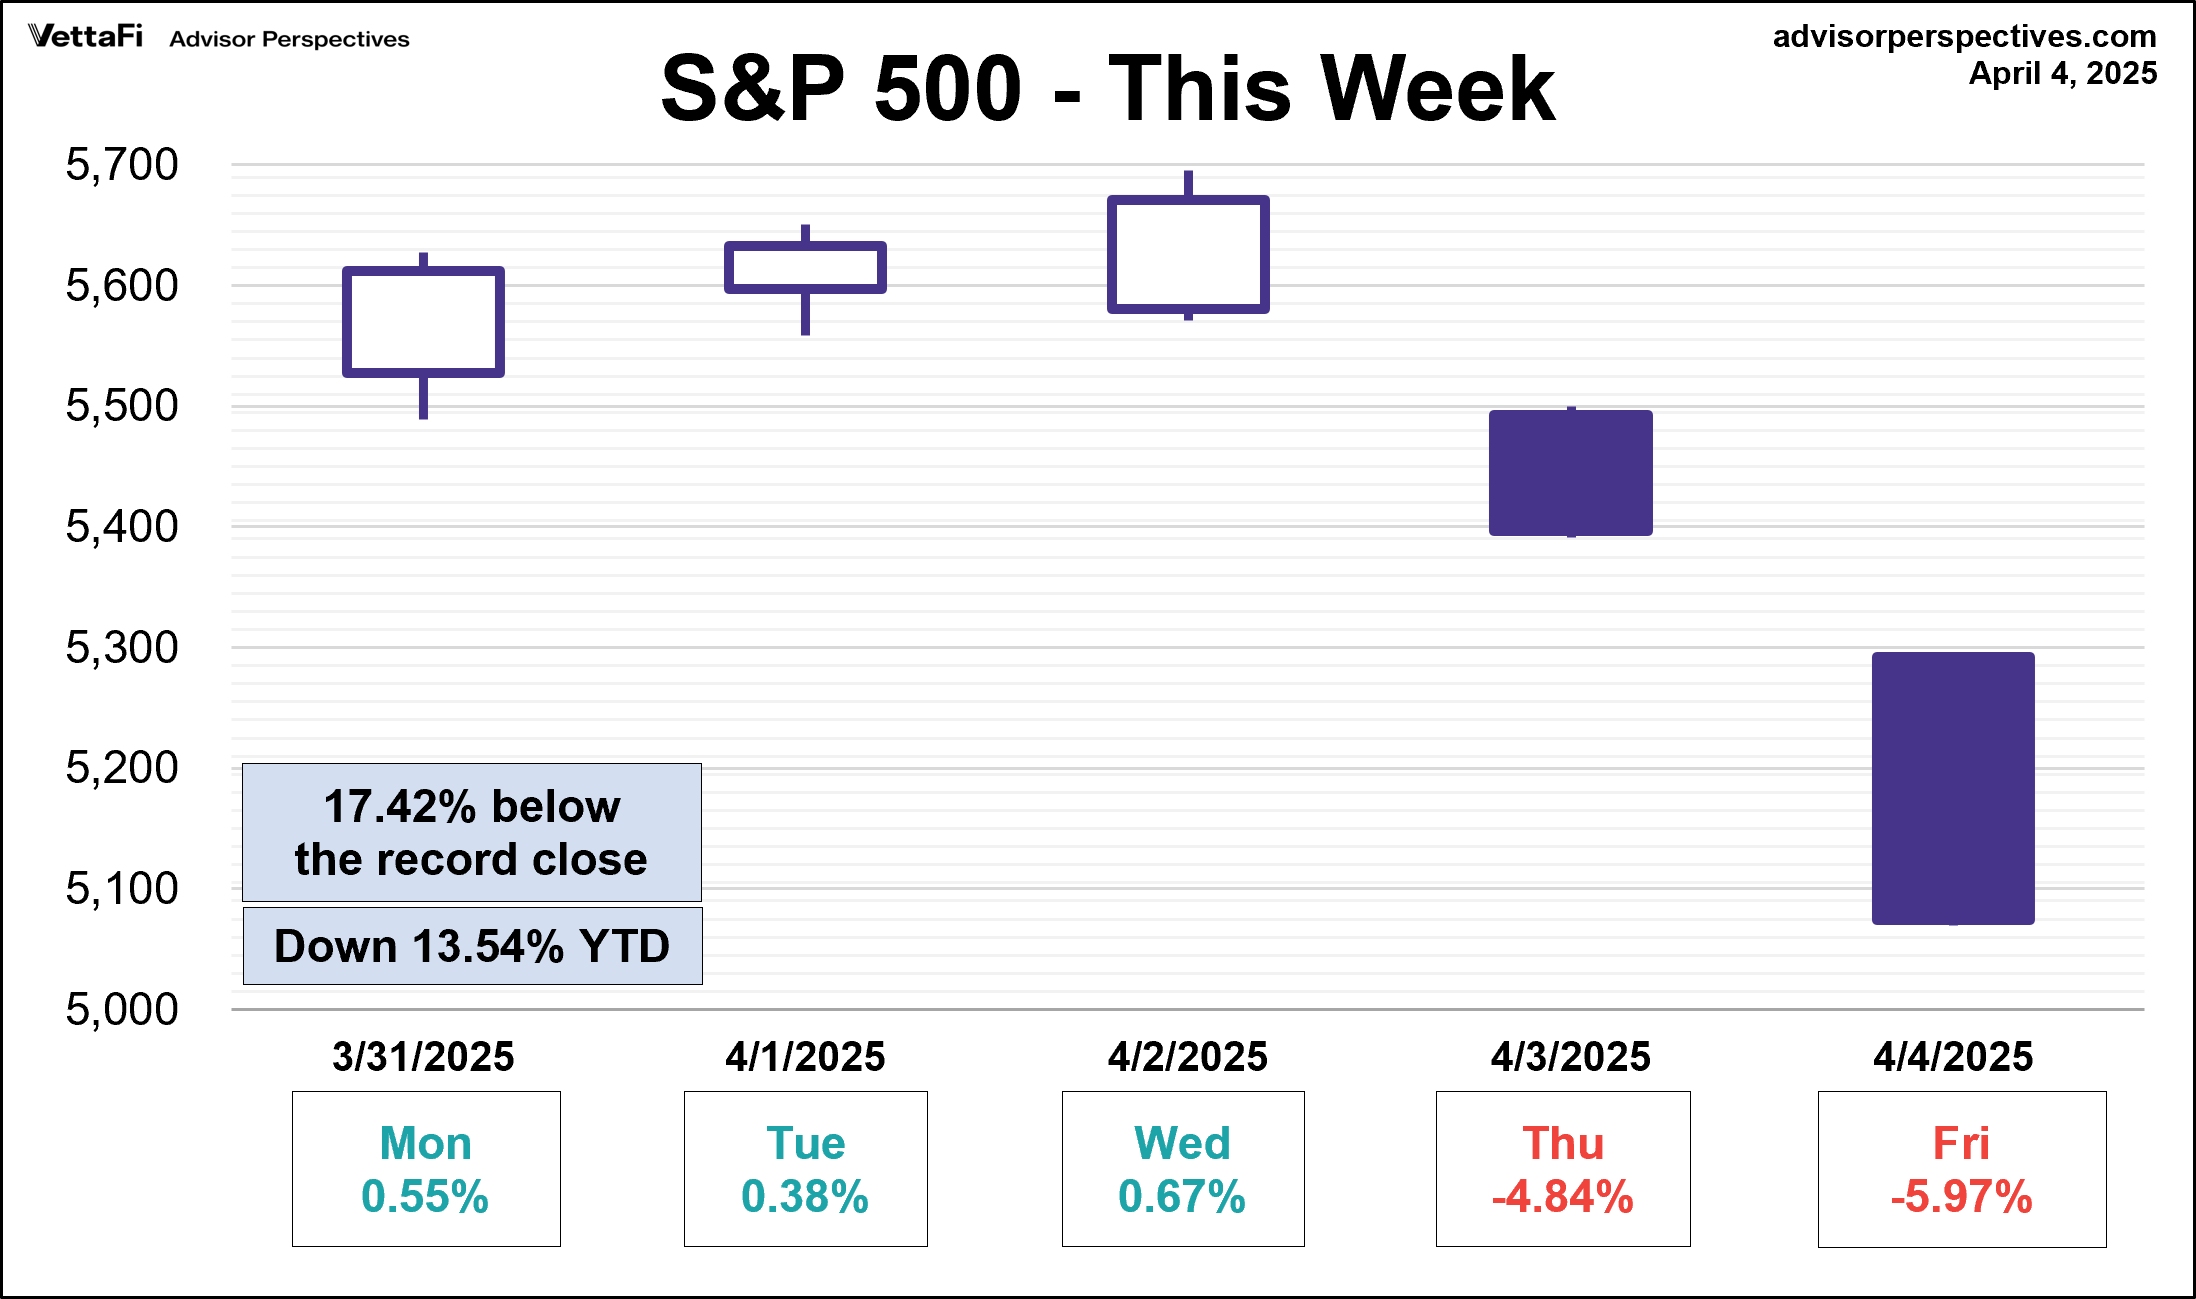
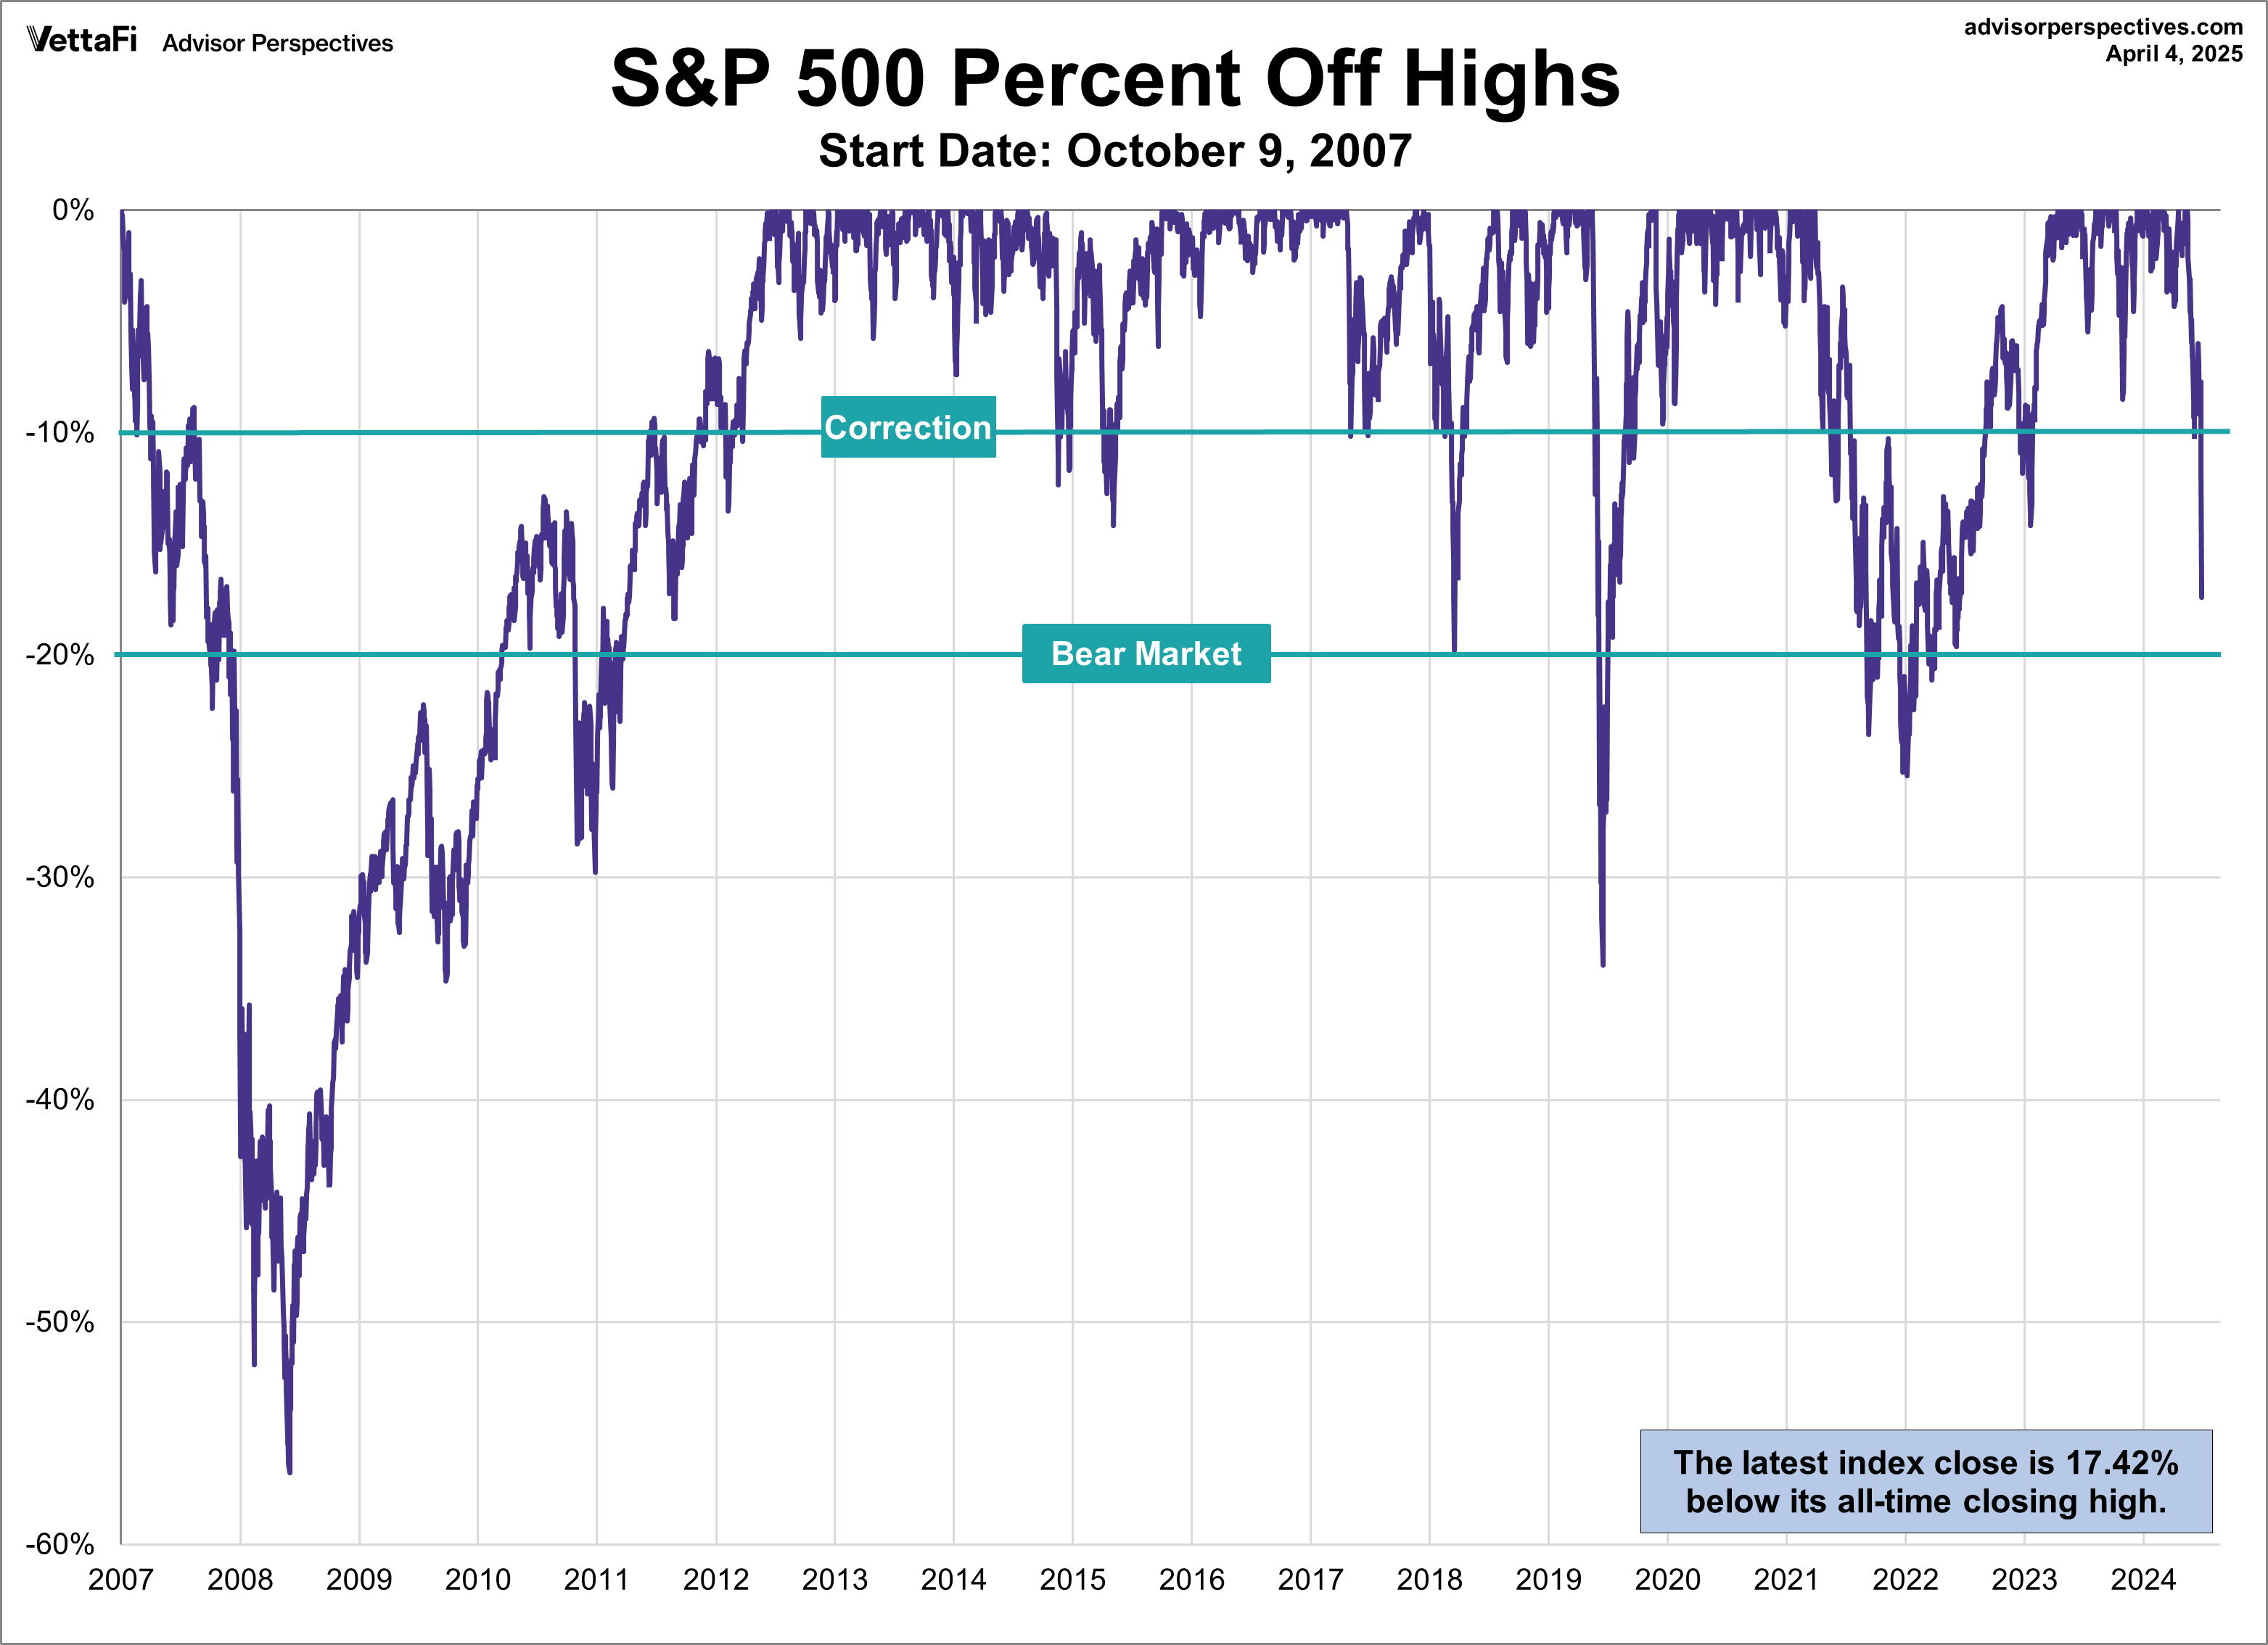
The S&P 500 began the week with three straight daily gains but then “Liberation Day” led the index to its two worst days since March 2020. The index fell 9.1% this week and has re-entered correction territory, sitting 17.42% below its record close from February 19th, 2025.
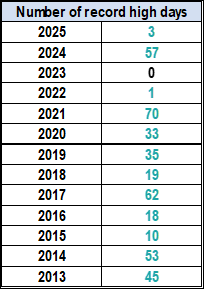
The table below summarizes the number of record highs reached each year dating back to 2013.
Here is a snapshot of the index from the past week:
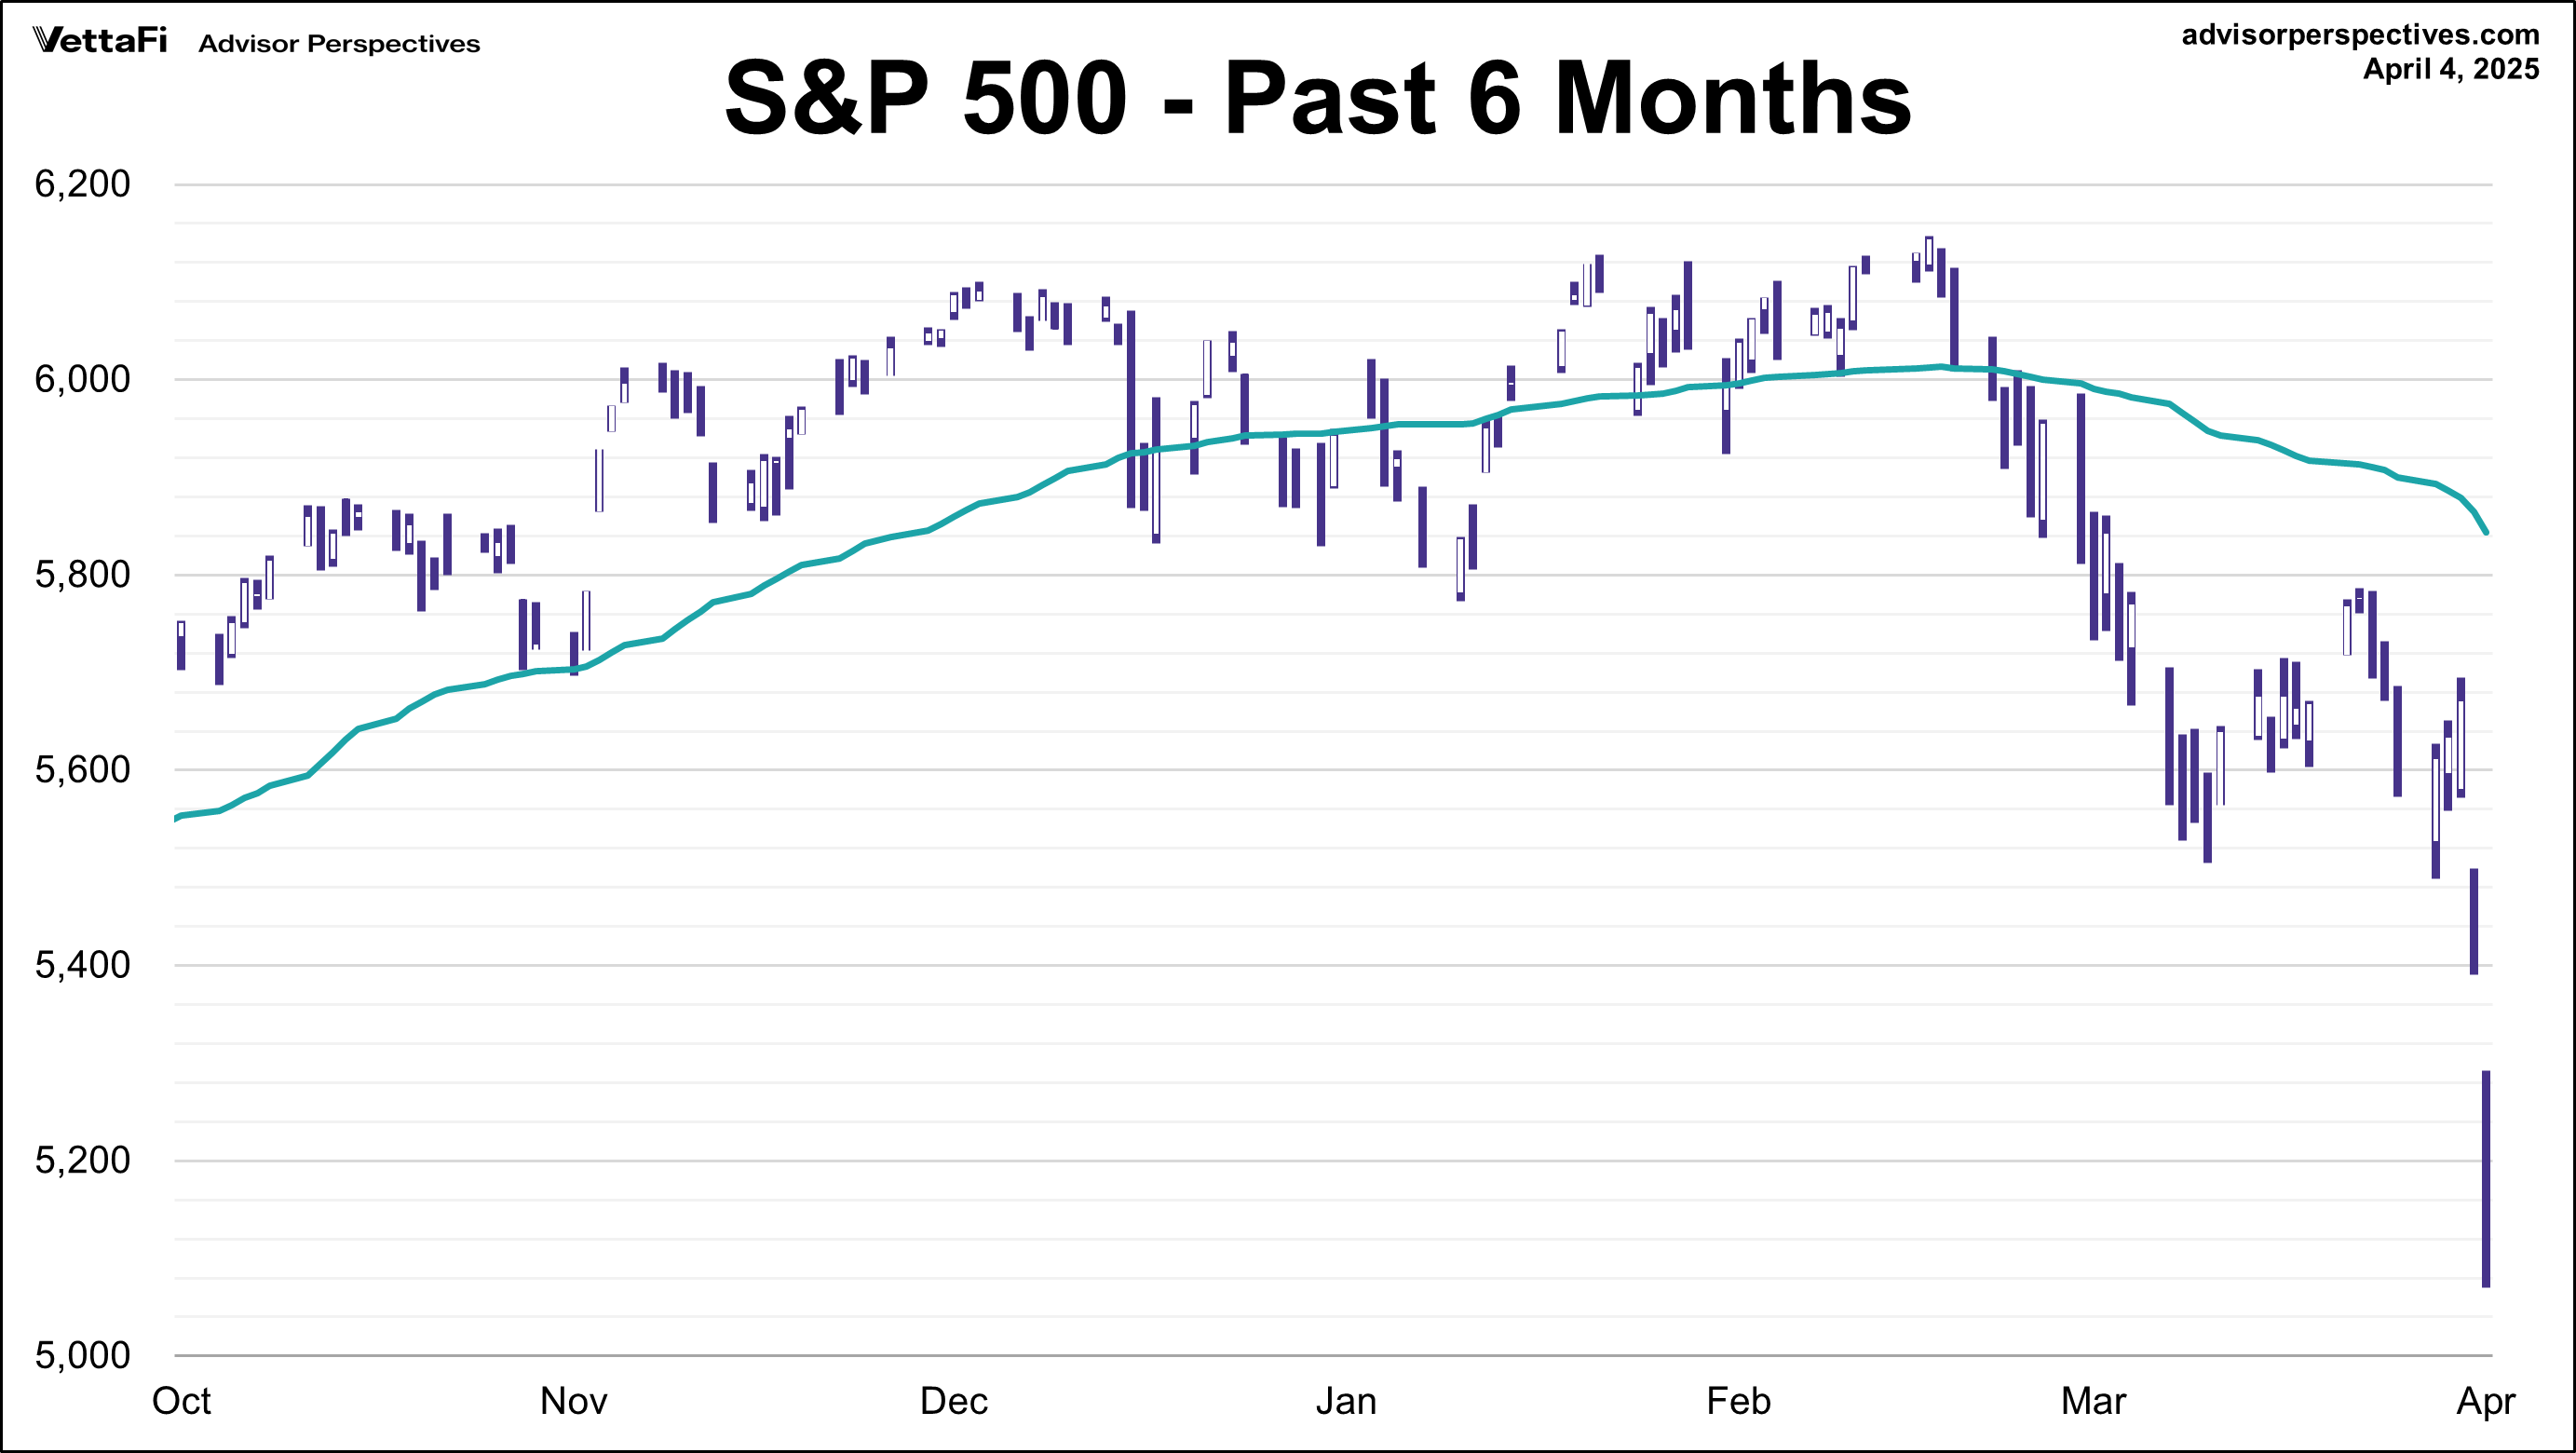
Here is a snapshot of the index from the past six months with a 50-day moving average:
S&P 500: A Perspective on Drawdowns
On October 9, 2007 the S&P 500 reached a then all-time high, closing the day at 1565.15. Then on March 9, 2009, the index dropped ~57% off of its high from exactly 17 months before, It closed out the day at 676.53. This time period became known as the Global Financial Crisis. It took over 5 years before the index reached a new then all-time high on March 28, 2013. It closed out that day at 1569.19. The chart below is a snapshot of record highs and selloffs since the 2007 peak reached on October 9, 2007.
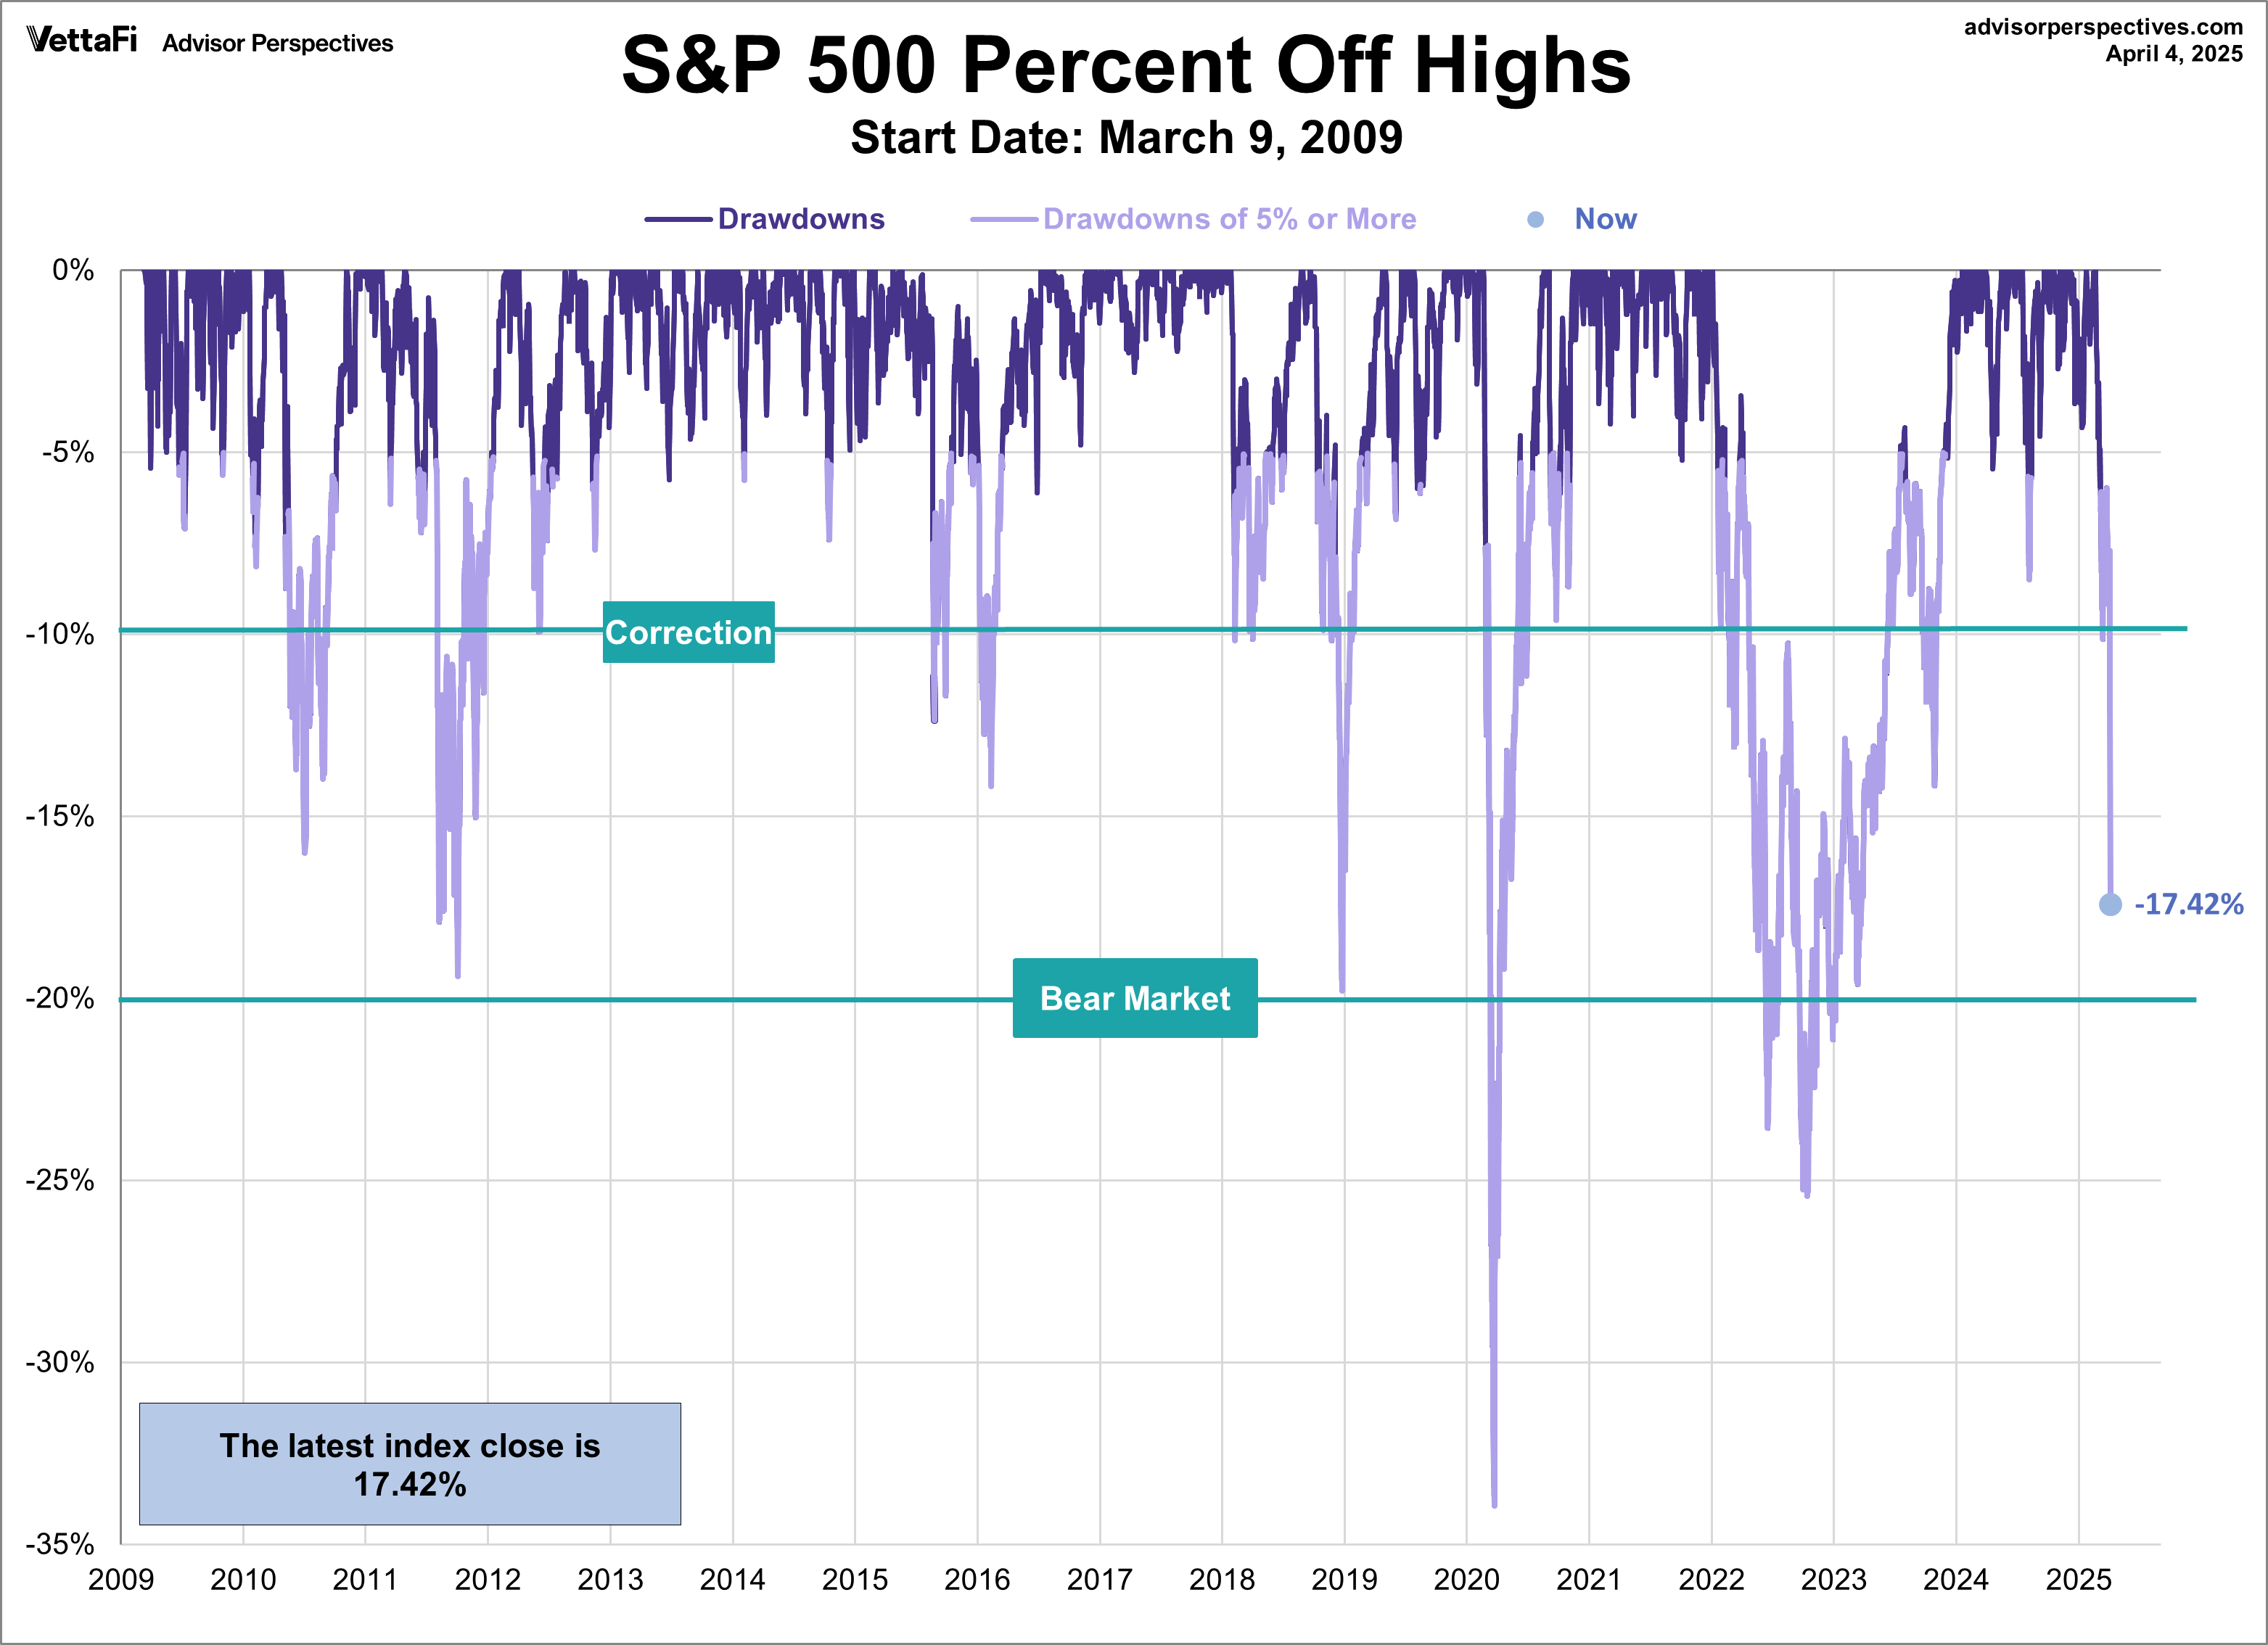
What happens if we take out the Global Financial Crisis? Here’s a snapshot the same chart above where the start date has been changed to the trough reached on March 9, 2009. Note the recent selloffs in 2022.
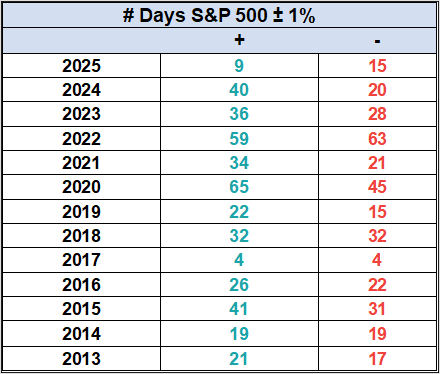
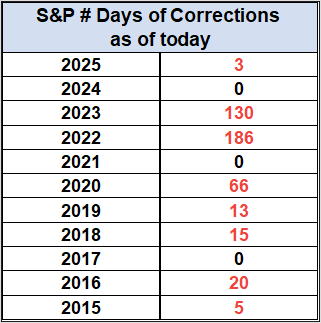
Here are a few tables with the number of days of a 1% or greater change in either direction and the number of days of corrections (down 10% or more from the record high).
 |
 |
And here is a linear chart of the index since October 9, 2007:
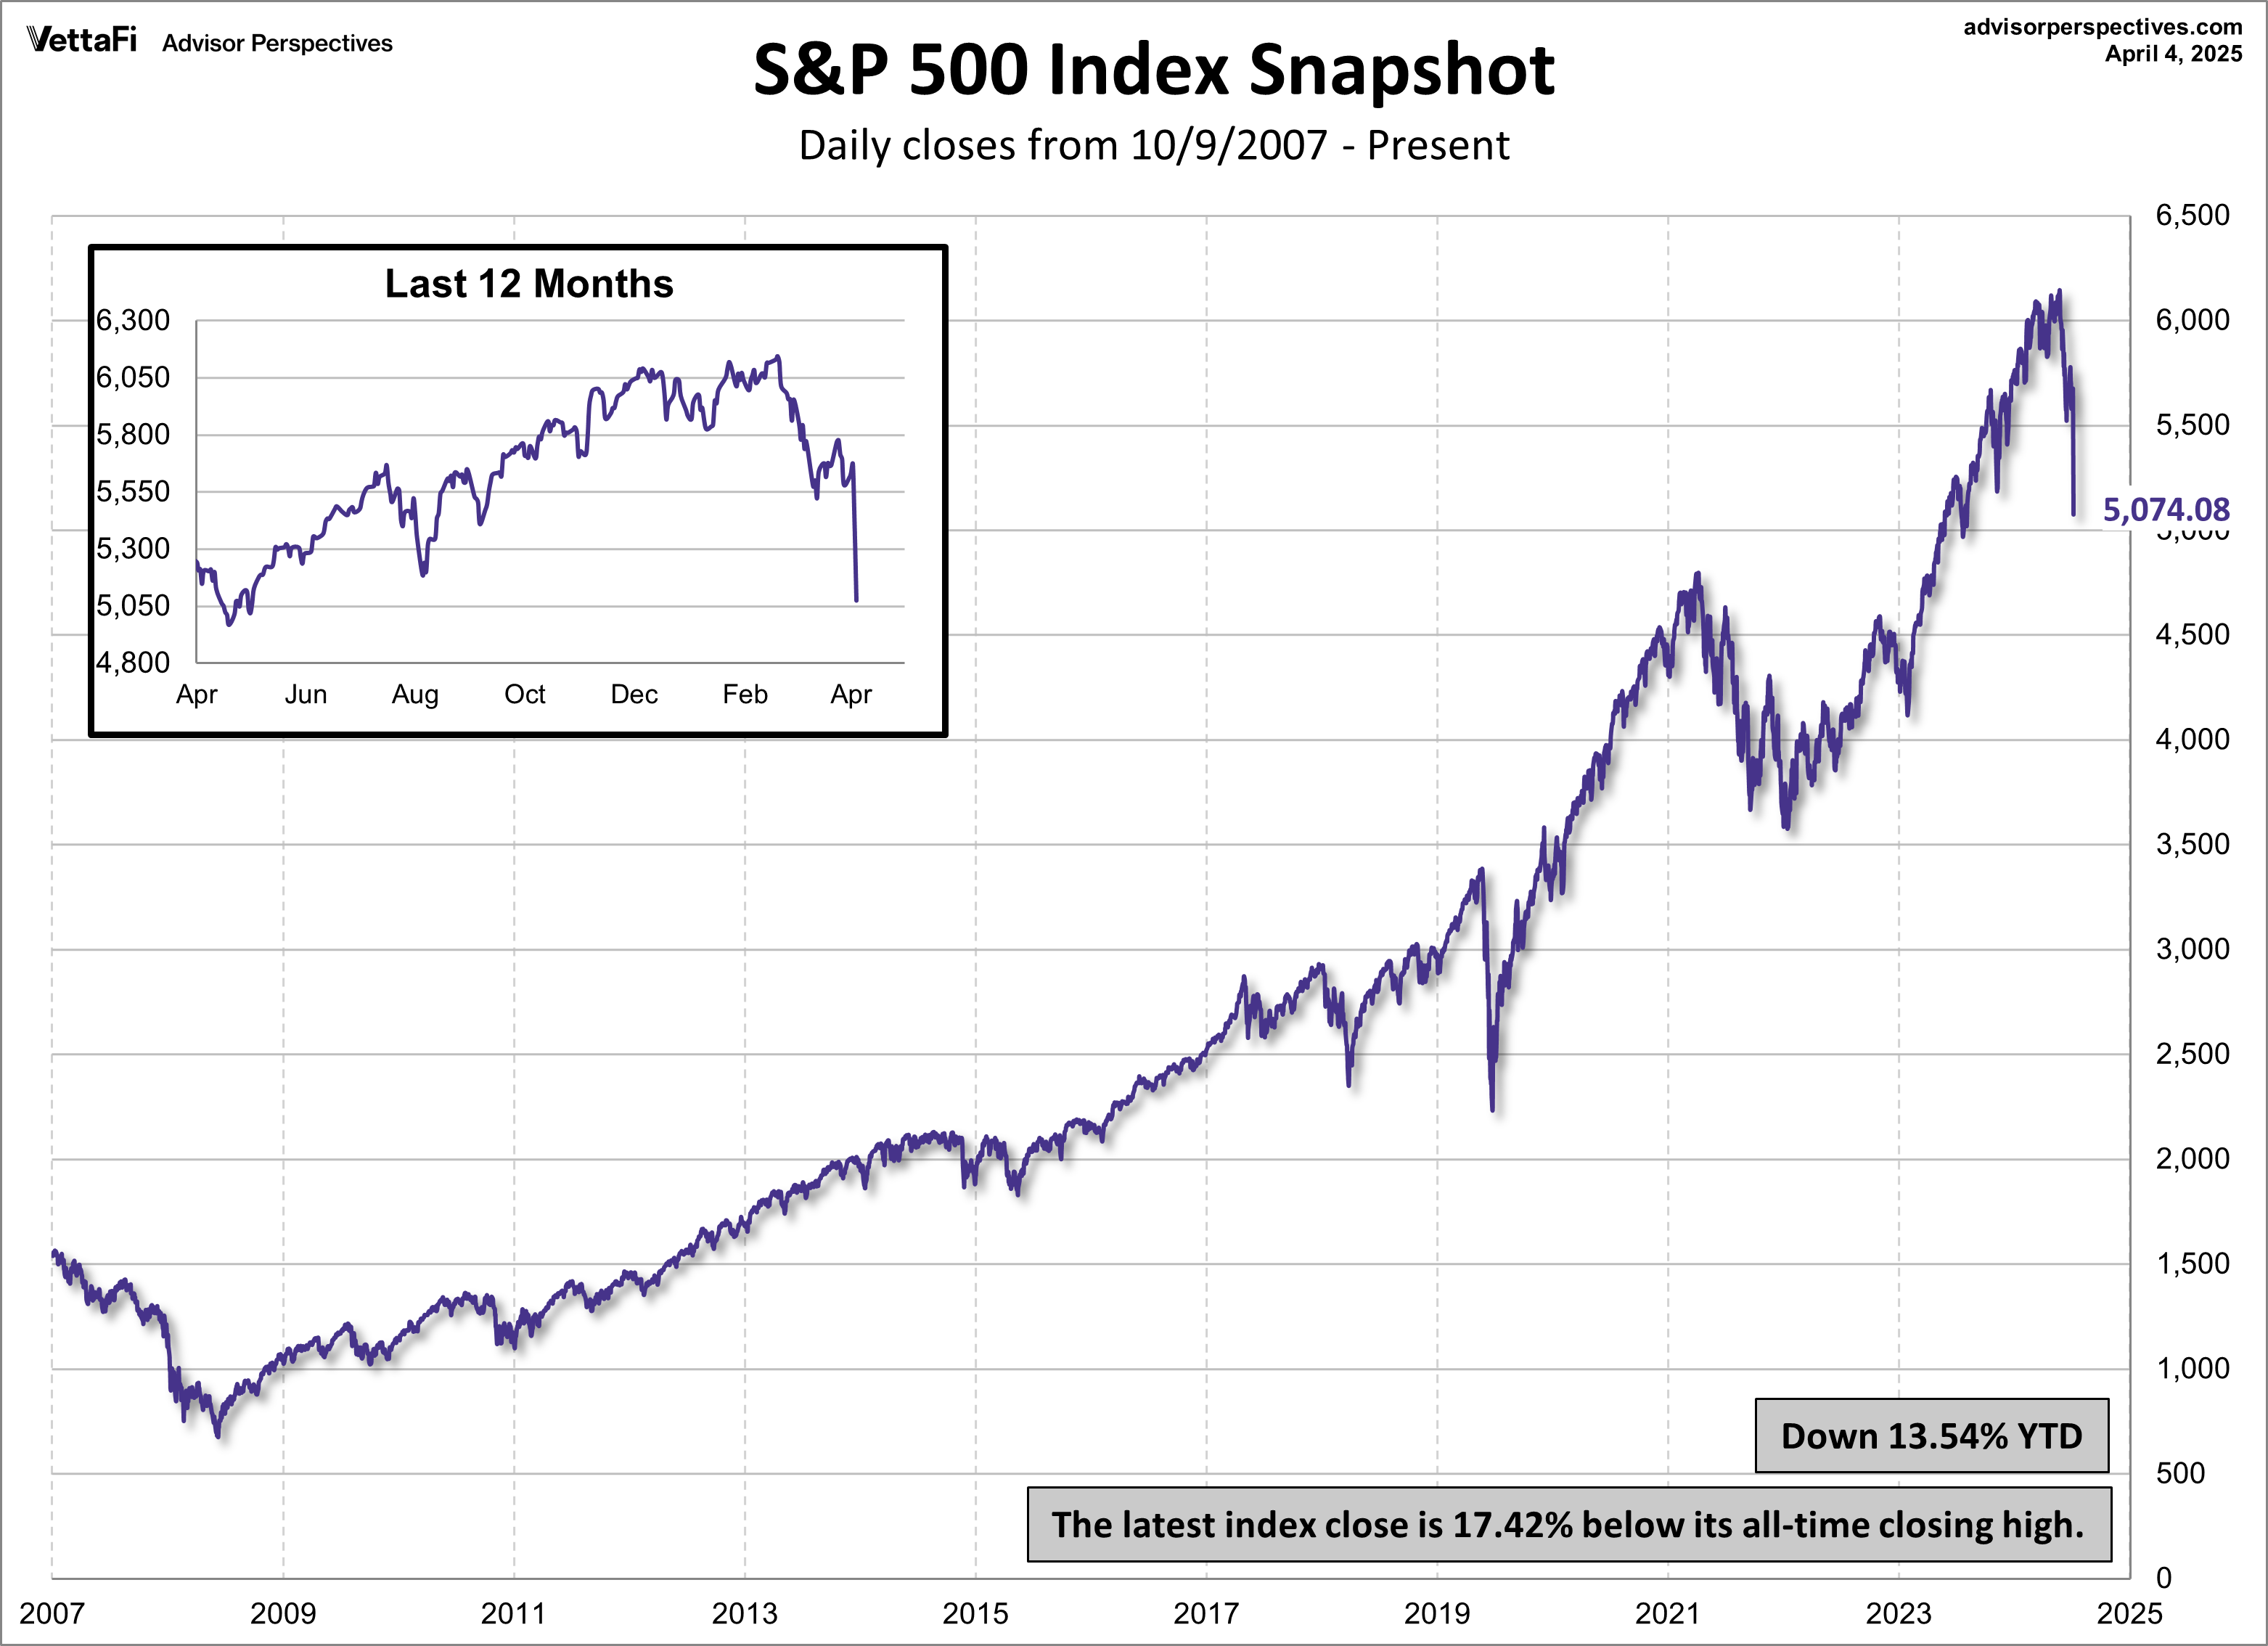
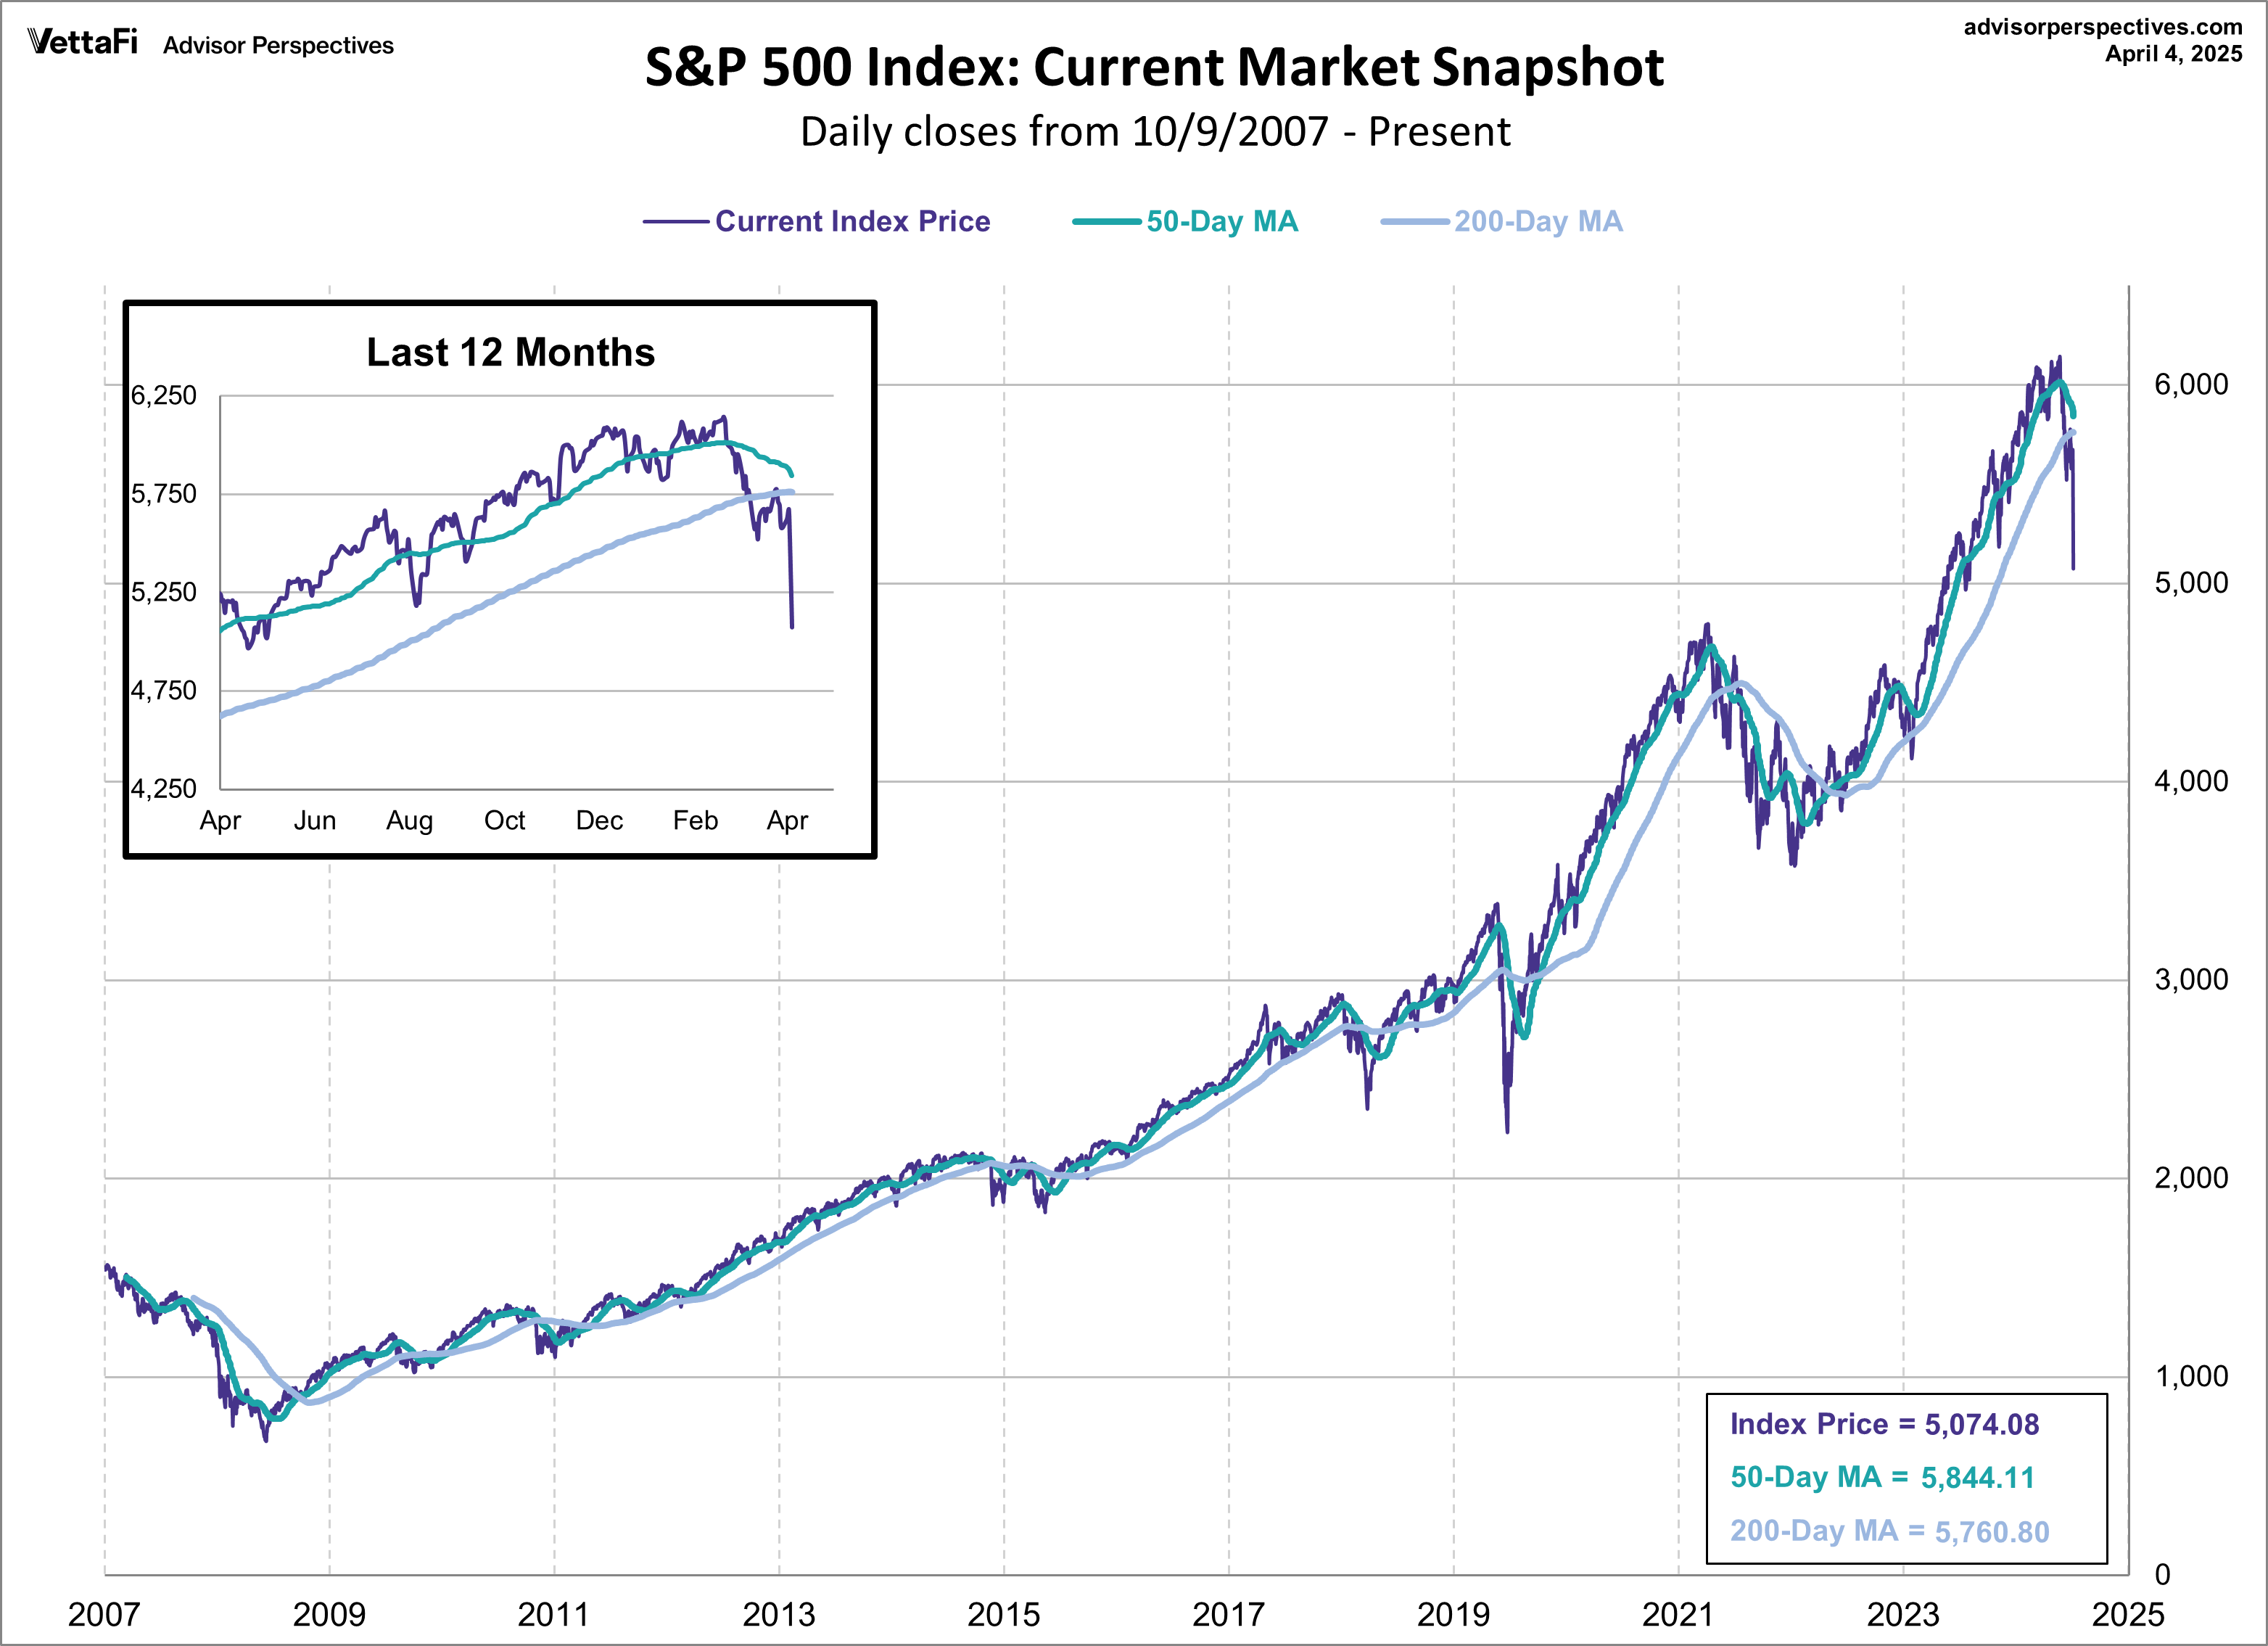
Here is a linearly scaled version of the same chart with the 50- and 200-day moving averages. The index has been below the 50-day moving average since February 24th. It has beenbelow the 200-day moving average since March 26th.
S&P 500: A Perspective on Volatility
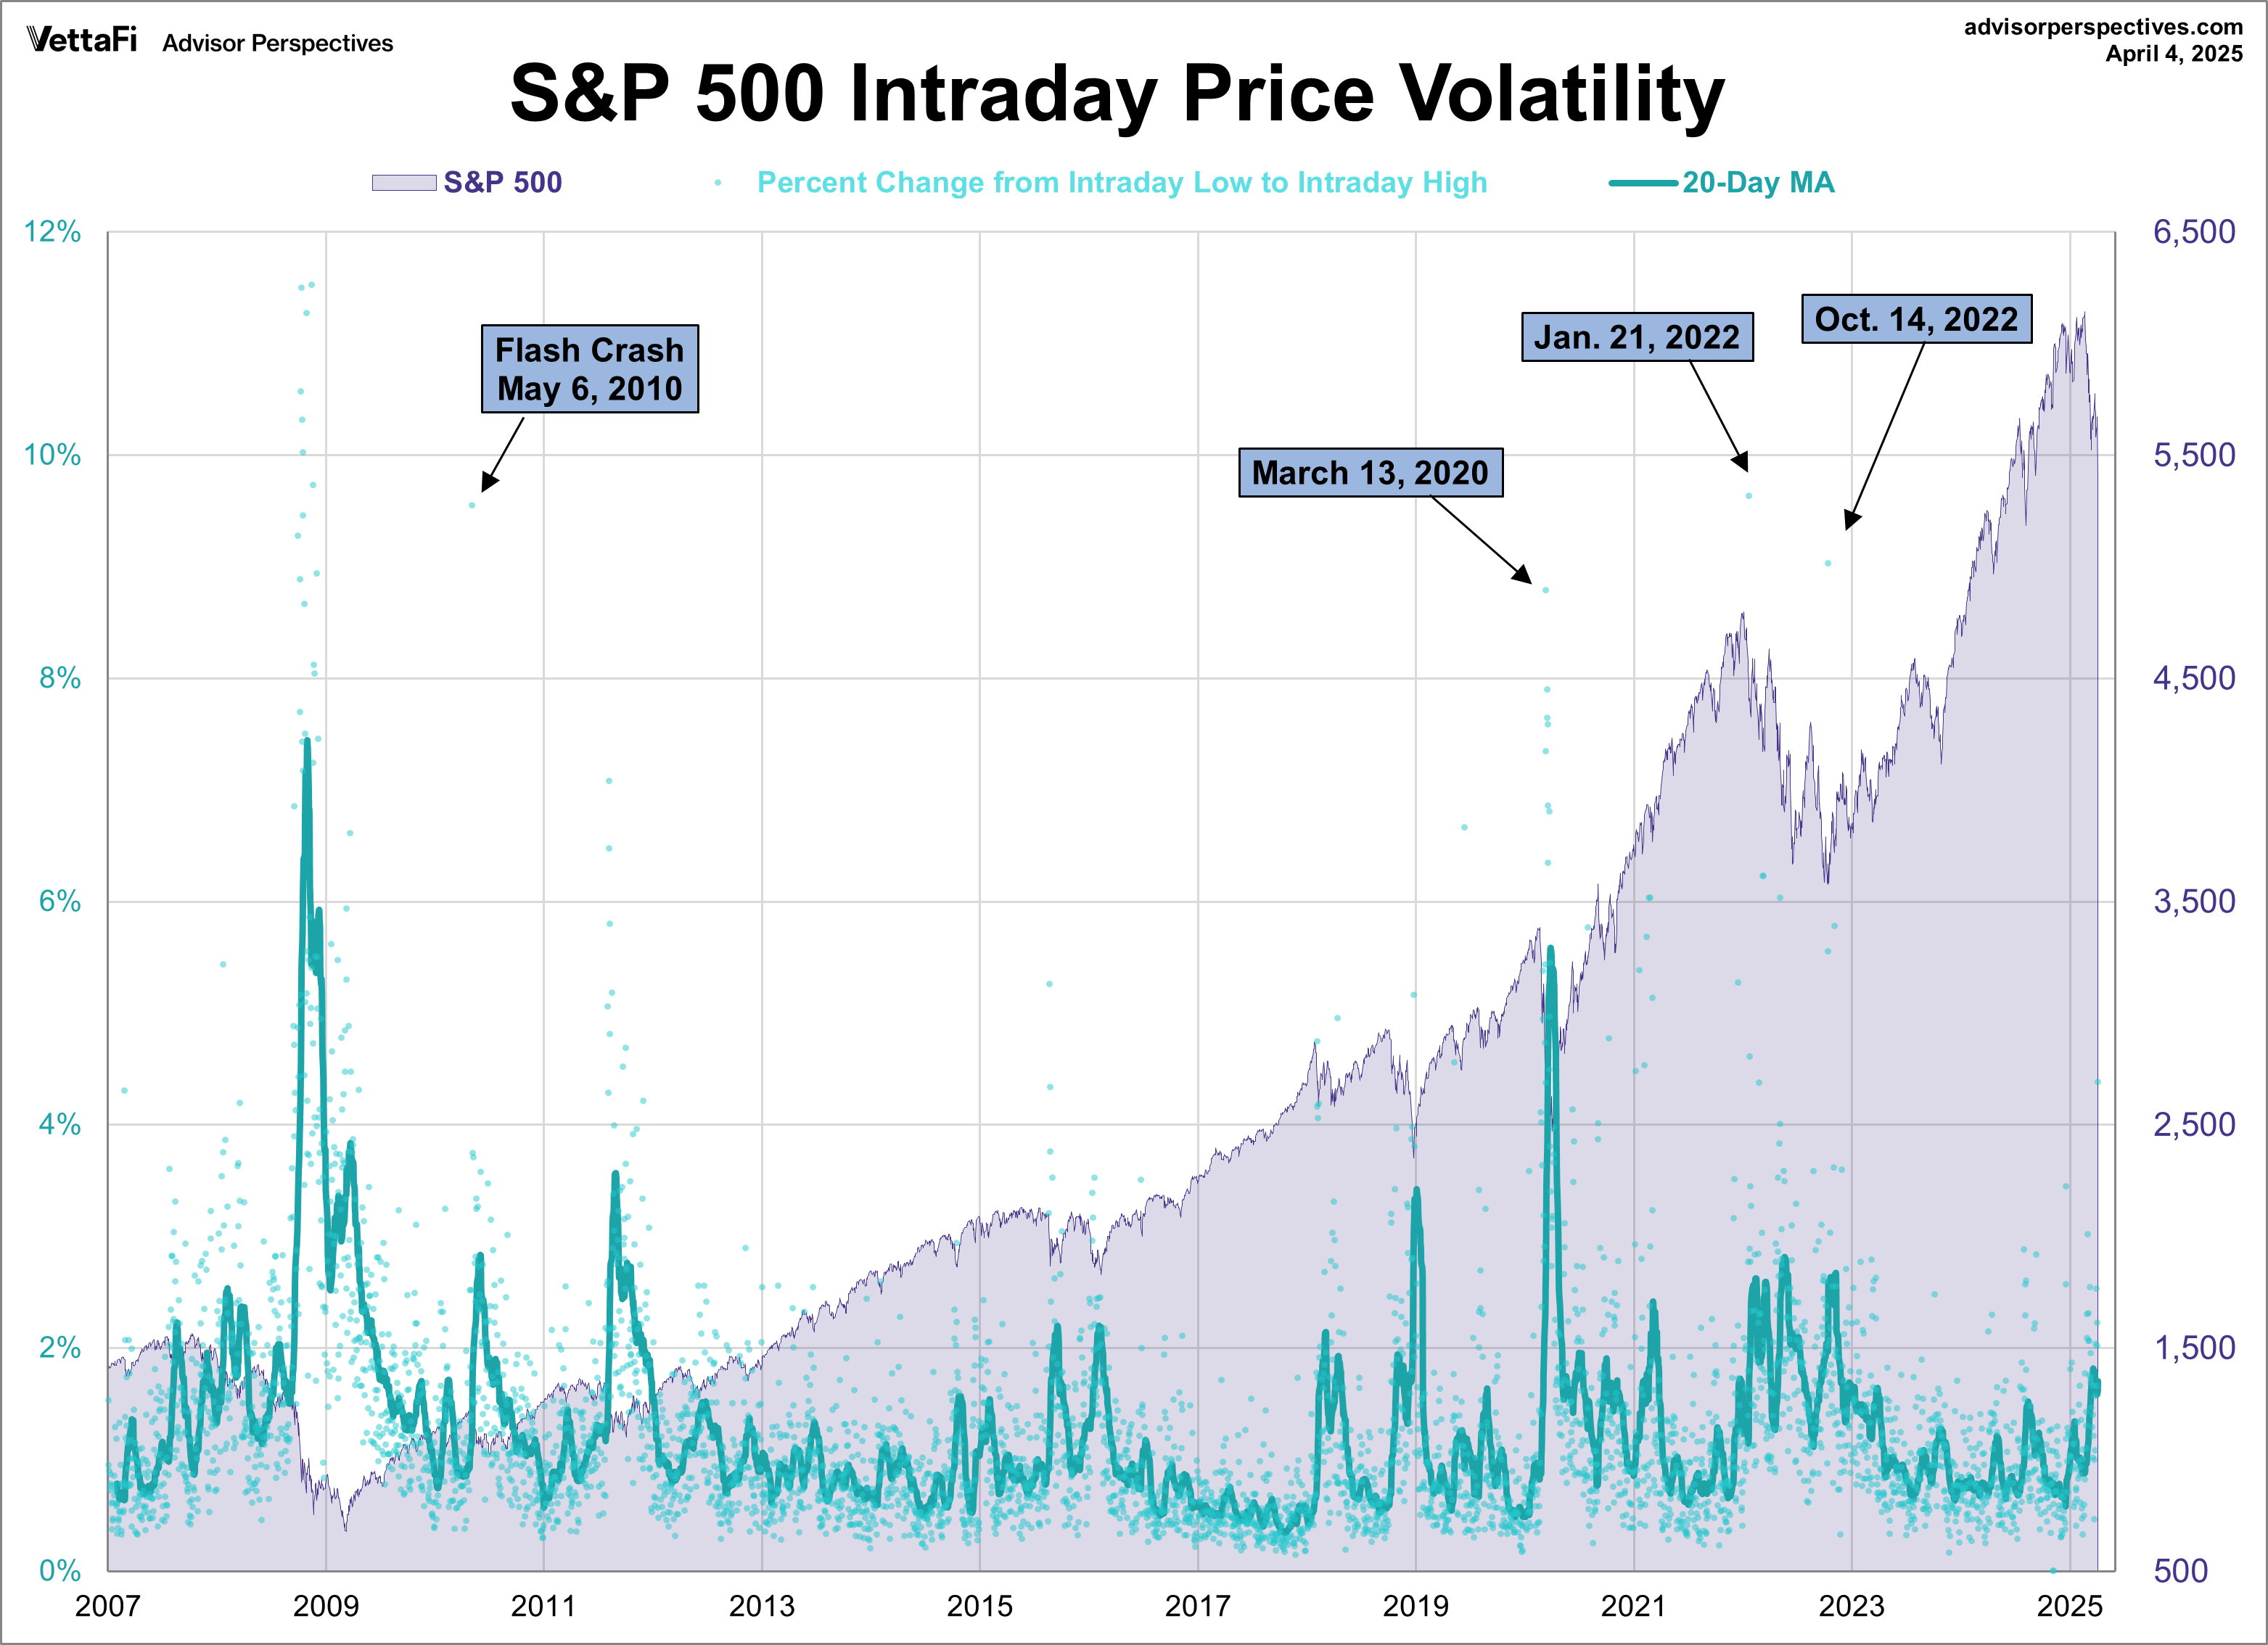
For a sense of the correlation between the closing price and intraday volatility, the chart below overlays the S&P 500 since 2007 with the intraday price range. On April 4th, the index experienced its largest intraday price volatility (4.38%) since November 4th, 2022 (5.78%). Also included is the 20-day moving average to identify trends in volatility. Over the past 20 days, the average percent change from the intraday low to the intraday high is 1.70%.
S&P 500 versus S&P Equal Weight
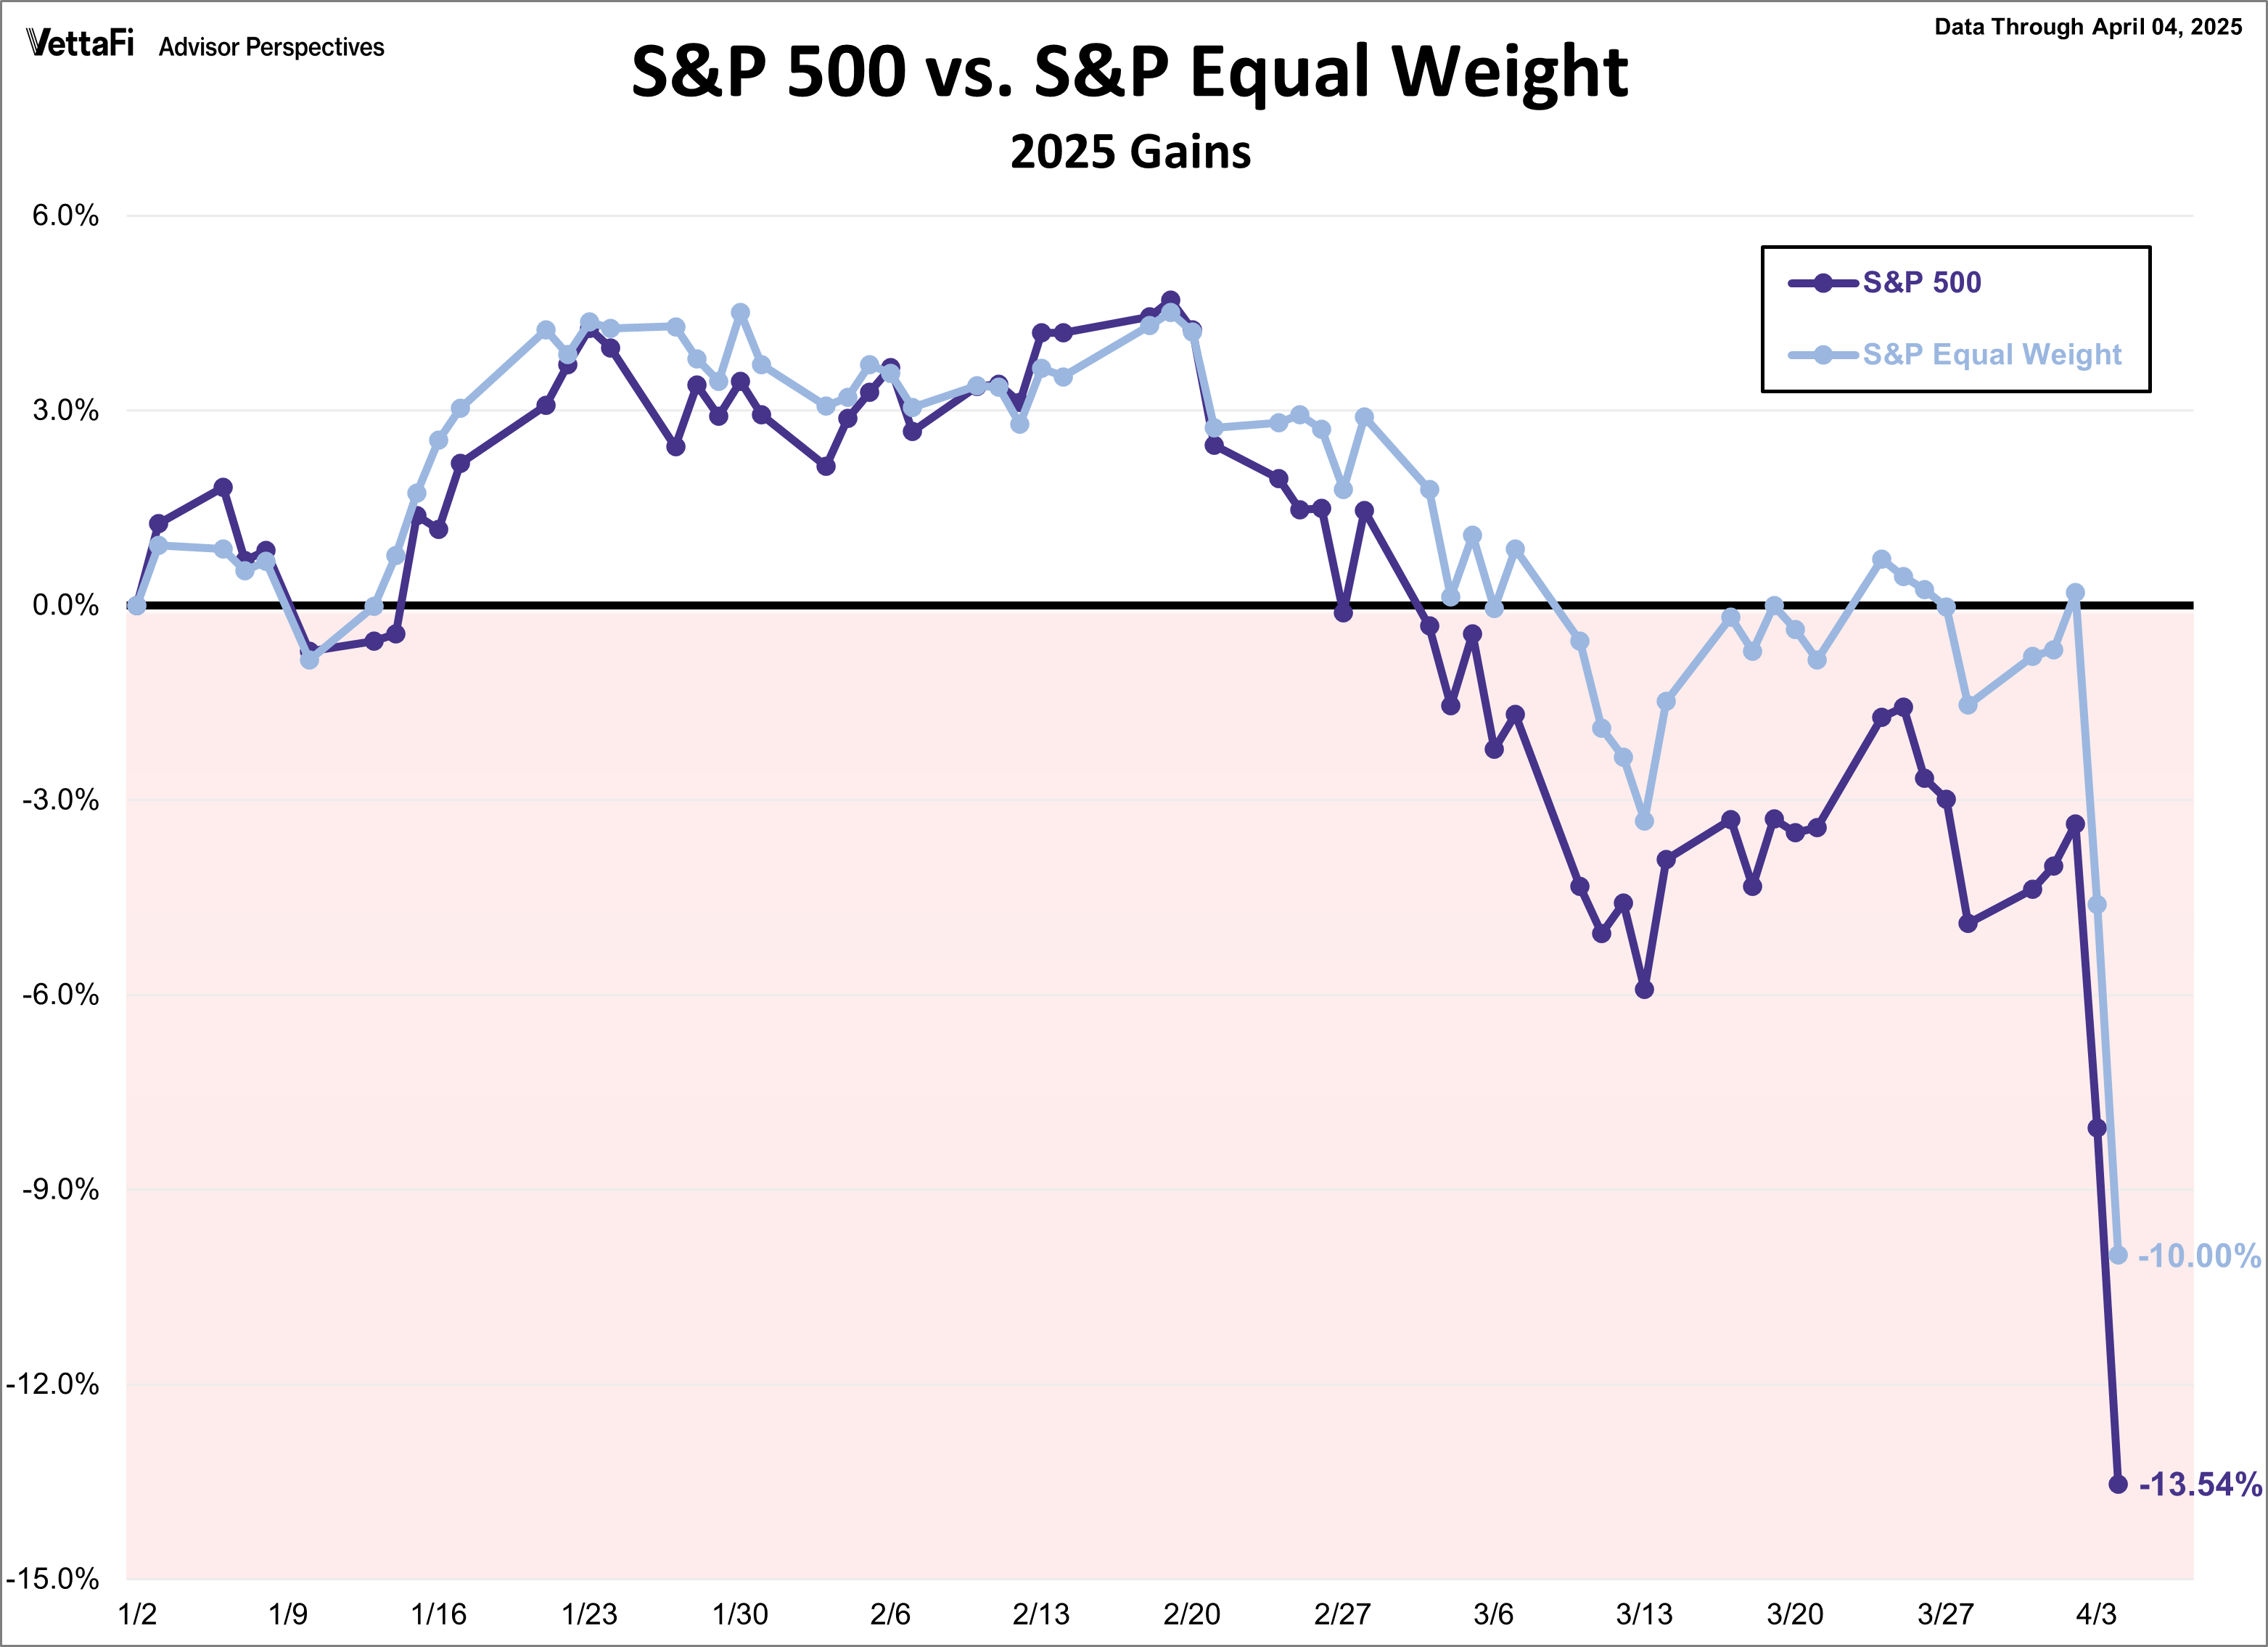
The S&P 500 is market cap-weighted index which includes roughly the 500 largest U.S. stocks spanning 11 sectors. The S&P 500 Equal Weight Index includes the same constituents as the S&P 500 but each company is equally weighted at a fixed weight. So how do these two indexes match up against each other this year?
The S&P 500 is currently down 13.54% year to date, while the S&P Equal Weight is down 10.00% year to date.
ETFs associated with the S&P 500 include: iShares Core S&P 500 ETF (IVV), SPDR S&P 500 ETF Trust (SPY), Vanguard S&P 500 ETF (VOO), SPDR Portfolio S&P 500 ETF (SPLG), and Invesco S&P 500® Equal Weight ETF (RSP).
Originally published on Advisor Perspectives.
For more news, information, and strategy, visit the Innovative ETFs Channel.
