
Editor’s note: Any and all references to time frames longer than one trading day are for purposes of market context only, and not recommendations of any holding time frame. Daily rebalancing ETFs are not meant to be held unmonitored for long periods. If you don’t have the resources, time or inclination to constantly monitor and manage your positions, leveraged and inverse ETFs are not for you.
As U.S. companies unveil their fourth-quarter (Q4) earnings, the spotlight is firmly on whether corporate profits can reignite after a rocky 2024. According to date from FactSet, analysts predict an 11.7% year-over-year earnings growth for the S&P 500*—the strongest since late 2021. But with inflated market valuations and mounting investor anxiety, this earnings season could either fuel the market’s fire or leave it gasping for air.
Earnings Growth: Adjusted Expectations
Back in late September, the outlook was even rosier, with projections of 14.5% growth. However, reality has tempered optimism, shaving estimates down to 11.7%. Guidance paints a mixed picture: while 71 S&P 500 companies have offered negative earnings per share (EPS)* guidance (well above the five-year average of 56), only 35 have issued positive guidance (below the five-year average of 42).
Sector Winners and Losers
Not all sectors are sharing the same optimism. Financials are the quarter’s MVP, with an impressive 38.9% expected earnings growth, thanks largely to the banking sector’s rebound. Communication Services and Information Technology aren’t far behind, boasting 20.7% and 13.9% growth, respectively. Even perennial underdogs—Utilities and Consumer Discretionary—are set to flex double-digit earnings expansion.
Revenue Trends: The Never-Ending Climb
Q4 also marks the 17th consecutive quarter of revenue growth for the S&P 500, with revenues expected to climb 4.6%. Technology companies lead this charge, leveraging the insatiable demand for digital transformation and tech services.
Valuation Watch: High Hopes or Hot Air?
The S&P 500’s forward P/E ratio* now stands at a lofty 21.8—well above the five- and ten-year averages. The market seems to have already priced in a rosy earnings season, leaving little room for disappointment. A failure to meet lofty expectations could spark turbulence for equities.
Investors Cautious, Markets Wobble
Despite strong earnings growth projections, investor sentiment isn’t exactly bullish. Major indices like the Dow Jones and Russell 2000 have been losing steam since November. Meanwhile, robust economic data is dampening hopes for Federal Reserve interest rate cuts, putting pressure on stocks as government-bond yields rise.
As Q4 earnings reports continue to emerge, investors should closely monitor sector-specific performances and corporate guidance to gauge the sustainability of earnings growth. While the anticipated earnings increase is a positive indicator, the elevated market valuations and cautious corporate outlooks suggest a complex landscape for U.S. equities in the near term.
Here’s a list of announcement dates with related Leveraged & Inverse ETFs, week-by-week for 2024’s Q4 earnings season.
Earnings dates are subject to change without notice.
Q4 2024 Earnings Season – % of Each Index Reporting by Week
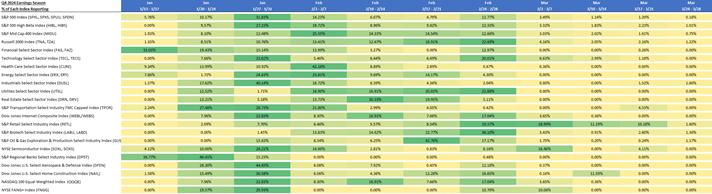
Source: Data sourced from FactSet Earnings Insight, January 10, 2025. Figures represent percent of companies in each index expected to release earnings reports by week. Green shading identifies the week with the highest percentages. Index descriptions are provided at the end of the page. One cannot directly invest in an index.
S&P 500 Index
- Direxion Daily S&P 500 Bear 1X Shares (SPDN)
- Direxion Daily S&P 500 Bull 2X Shares (SPUU)
- Direxion Daily S&P 500 Bull (SPXL) and Bear (SPXS) 3X Shares
| Ticker | Name | Weight in the Index | Expected Earnings Release |
| NVDA UW | NVIDIA Corp | 6.83% | 2/26/2025 |
| MSFT UW | Microsoft Corp | 6.30% | 1/30/2025 |
| AMZN UW | Amazon.com Inc | 4.15% | 1/31/2025 |
| META UW | Meta Platforms Inc | 2.65% | 1/31/2025 |
| GOOGL UW | Alphabet Inc | 2.28% | 1/30/2025 |
| TSLA UW | Tesla Inc | 2.18% | 1/29/2025 |
| AVGO UW | Broadcom Inc | 2.13% | 3/7/2025 |
| GOOG UW | Alphabet Inc | 1.87% | 1/30/2025 |
| BRK/B UN | Berkshire Hathaway Inc | 1.66% | 2/24/2025 |
| JPM UN | JPMorgan Chase & Co | 1.37% | 1/15/2025 |
S&P 500 High Beta Index
| Ticker | Name | Weight in the Index | Expected Earnings Release |
| SMCI UW | Super Micro Computer Inc | 3.24% | 1/29/2025 |
| AVGO UW | Broadcom Inc | 2.07% | 3/7/2025 |
| TER UW | Teradyne Inc | 1.99% | 1/30/2025 |
| PLTR UW | Palantir Technologies Inc | 1.95% | 2/5/2025 |
| TSLA UW | Tesla Inc | 1.89% | 1/29/2025 |
| NVDA UW | NVIDIA Corp | 1.70% | 2/26/2025 |
| KLAC UW | KLA Corp | 1.63% | 1/30/2025 |
| LRCX UW | Lam Research Corp | 1.54% | 1/29/2025 |
| ANET UN | Arista Networks Inc | 1.46% | 2/12/2025 |
| MPWR UW | Monolithic Power Systems Inc | 1.45% | 2/7/2025 |
Financials Select Sector Index
| Ticker | Name | Weight in the Index | Expected Earnings Release |
| BRK/B UN | Berkshire Hathaway Inc | 12.20% | 2/24/2025 |
| JPM UN | JPMorgan Chase & Co | 10.07% | 1/15/2025 |
| V UN | Visa Inc | 7.97% | 1/24/2025 |
| MA UN | Mastercard Inc | 6.23% | 1/31/2025 |
| BAC UN | Bank of America Corp | 4.53% | 1/16/2025 |
| WFC UN | Wells Fargo & Co | 3.51% | 1/15/2025 |
| GS UN | Goldman Sachs Group Inc/The | 2.66% | 1/15/2025 |
| AXP UN | American Express Co | 2.48% | 1/24/2025 |
| MS UN | Morgan Stanley | 2.31% | 1/16/2025 |
| SPGI UN | S&P Global Inc | 2.31% | 2/7/2025 |
Health Care Select Sector Index
| Ticker | Name | Weight in the Index | Expected Earnings Release |
| LLY UN | Eli Lilly & Co | 12.06% | 2/6/2025 |
| UNH UN | UnitedHealth Group Inc | 9.34% | 1/16/2025 |
| JNJ UN | Johnson & Johnson | 6.70% | 1/22/2025 |
| MRK UN | Merck & Co Inc | 4.92% | 2/4/2025 |
| TMO UN | Thermo Fisher Scientific Inc | 4.08% | 1/30/2025 |
| ISRG UW | Intuitive Surgical Inc | 3.77% | 1/23/2025 |
| DHR UN | Danaher Corp | 2.99% | 1/29/2025 |
| PFE UN | Pfizer Inc | 2.96% | 2/4/2025 |
| BSX UN | Boston Scientific Corp | 2.78% | 2/5/2025 |
| AMGN UW | Amgen Inc | 2.76% | 2/6/2025 |
Industrials Select Sector Index
| Ticker | Name | Weight in the Index | Expected Earnings Release |
| GE UN | General Electric Co | 4.58% | 1/23/2025 |
| CAT UN | Caterpillar Inc | 4.25% | 2/5/2025 |
| RTX UN | RTX Corp | 3.76% | 1/28/2025 |
| HON UW | Honeywell International Inc | 3.51% | 1/31/2025 |
| UNP UN | Union Pacific Corp | 3.43% | 1/23/2025 |
| UBER UN | Uber Technologies Inc | 3.32% | 2/7/2025 |
| ETN UN | Eaton Corp PLC | 3.31% | 1/31/2025 |
| BA UN | Boeing Co/The | 3.17% | 1/28/2025 |
| DE UN | Deere & Co | 2.56% | 2/14/2025 |
| LMT UN | Lockheed Martin Corp | 2.42% | 1/28/2025 |
Real Estate Select Sector Index
| Ticker | Name | Weight in the Index | Expected Earnings Release |
| PLD UN | Prologis Inc | 9.53% | 1/21/2025 |
| EQIX UW | Equinix Inc | 8.90% | 2/12/2025 |
| WELL UN | Welltower Inc | 7.30% | 2/13/2025 |
| DLR UN | Digital Realty Trust Inc | 5.50% | 2/13/2025 |
| SPG UN | Simon Property Group Inc | 5.21% | 2/5/2025 |
| PSA UN | Public Storage | 4.51% | 2/20/2025 |
| O UN | Realty Income Corp | 4.45% | 2/20/2025 |
| CBRE UN | CBRE Group Inc | 3.79% | 2/13/2025 |
| CCI UN | Crown Castle Inc | 3.68% | 1/24/2025 |
| EXR UN | Extra Space Storage Inc | 3.04% | 2/27/2025 |
Dow Jones Internet Composite Index
| Ticker | Name | Weight in the Index | Expected Earnings Release |
| META UW | Meta Platforms Inc | 10.04% | 1/31/2025 |
| NFLX UW | Netflix Inc | 7.96% | 1/21/2025 |
| CRM UN | Salesforce Inc | 6.58% | 2/28/2025 |
| GOOGL UW | Alphabet Inc | 5.72% | 1/30/2025 |
| ANET UN | Arista Networks Inc | 5.02% | 2/12/2025 |
| CSCO UW | Cisco Systems Inc | 4.72% | 2/14/2025 |
| GOOG UW | Alphabet Inc | 4.70% | 1/30/2025 |
| BKNG UW | Booking Holdings Inc | 4.32% | 2/21/2025 |
| PYPL UW | PayPal Holdings Inc | 4.00% | 2/4/2025 |
| DASH UW | DoorDash Inc | 2.63% | 2/11/2025 |
S&P Biotechnology Select Industry Index
| Ticker | Name | Weight in the Index | Expected Earnings Release |
| NBIX UW | Neurocrine Biosciences Inc | 2.53% | 2/7/2025 |
| BMRN UW | BioMarin Pharmaceutical Inc | 2.47% | 2/21/2025 |
| NTRA UW | Natera Inc | 2.40% | 2/28/2025 |
| INCY UW | Incyte Corp | 2.39% | 2/13/2025 |
| SRPT UW | Sarepta Therapeutics Inc | 2.38% | 2/28/2025 |
| MRNA UW | Moderna Inc | 2.37% | 2/21/2025 |
| UTHR UW | United Therapeutics Corp | 2.37% | 2/21/2025 |
| GILD UW | Gilead Sciences Inc | 2.29% | 2/11/2025 |
| BIIB UW | Biogen Inc | 2.27% | 2/13/2025 |
| AMGN UW | Amgen Inc | 2.26% | 2/6/2025 |
NYSE Semiconductor Index
| Ticker | Name | Weight in the Index | Expected Earnings Release |
| AVGO UW | Broadcom Inc | 11.39% | 3/7/2025 |
| NVDA UW | NVIDIA Corp | 8.16% | 2/26/2025 |
| QCOM UW | QUALCOMM Inc | 6.39% | 1/31/2025 |
| TXN UW | Texas Instruments Inc | 6.08% | 1/23/2025 |
| MRVL UW | Marvell Technology Inc | 5.06% | 3/7/2025 |
| KLAC UW | KLA Corp | 4.29% | 1/30/2025 |
| TSM UN | Taiwan Semiconductor Manufacturing Co Ltd | 4.12% | 1/16/2025 |
| MU UW | Micron Technology Inc | 4.11% | 3/20/2025 |
| ASML UW | ASML Holding NV | 3.95% | 1/29/2025 |
| NXPI UW | NXP Semiconductors NV | 3.70% | 2/3/2025 |
Dow Jones U.S. Select Home Construction Index
| Ticker | Name | Weight in the Index | Expected Earnings Release |
| DHI UN | DR Horton Inc | 14.19% | 1/21/2025 |
| LEN UN | Lennar Corp | 11.09% | 3/13/2025 |
| NVR UN | NVR Inc | 8.56% | 1/30/2025 |
| PHM UN | PulteGroup Inc | 7.81% | 1/30/2025 |
| LOW UN | Lowe’s Cos Inc | 4.71% | 2/27/2025 |
| HD UN | Home Depot Inc/The | 4.69% | 2/25/2025 |
| SHW UN | Sherwin-Williams Co/The | 4.61% | 1/30/2025 |
| TOL UN | Toll Brothers Inc | 4.43% | 2/20/2025 |
| BLD UN | TopBuild Corp | 3.23% | 2/28/2025 |
| LII UN | Lennox International Inc | 2.99% | 1/29/2025 |
NASDAQ 100 Equal Weighted Index
| Ticker | Name | Weight in the Index | Expected Earnings Release |
| META UW | Meta Platforms Inc | 10.04% | 1/31/2025 |
| NFLX UW | Netflix Inc | 7.96% | 1/21/2025 |
| CRM UN | Salesforce Inc | 6.58% | 2/28/2025 |
| GOOGL UW | Alphabet Inc | 5.72% | 1/30/2025 |
| ANET UN | Arista Networks Inc | 5.02% | 2/12/2025 |
| CSCO UW | Cisco Systems Inc | 4.72% | 2/14/2025 |
| GOOG UW | Alphabet Inc | 4.70% | 1/30/2025 |
| BKNG UW | Booking Holdings Inc | 4.32% | 2/21/2025 |
| PYPL UW | PayPal Holdings Inc | 4.00% | 2/4/2025 |
| DASH UW | DoorDash Inc | 2.63% | 2/11/2025 |
S&P Mid Cap 400® Index
| Ticker | Name | Weight in the Index | Expected Earnings Release |
| WSM UN | Williams-Sonoma Inc | 0.84% | 3/13/2025 |
| ILMN UW | Illumina Inc | 0.75% | 2/7/2025 |
| EXE UW | Expand Energy Corp | 0.74% | 2/20/2025 |
| EME UN | EMCOR Group Inc | 0.74% | 2/28/2025 |
| IBKR UW | Interactive Brokers Group Inc | 0.71% | 1/21/2025 |
| PSTG UN | Pure Storage Inc | 0.68% | 2/28/2025 |
| DOCU UW | DocuSign Inc | 0.62% | 3/7/2025 |
| BURL UN | Burlington Stores Inc | 0.61% | 3/7/2025 |
| RBA UN | RB Global Inc | 0.57% | 2/24/2025 |
| CSL UN | Carlisle Cos Inc | 0.57% | 2/6/2025 |
Russell 2000® Index
| Ticker | Name | Weight in the Index | Expected Earnings Release |
| FTAI UW | FTAI Aviation Ltd | 0.62% | 2/21/2025 |
| SFM UW | Sprouts Farmers Market Inc | 0.52% | 2/21/2025 |
| INSM UW | Insmed Inc | 0.42% | 2/21/2025 |
| PCVX UW | Vaxcyte Inc | 0.39% | 2/27/2025 |
| CRDO UW | Credo Technology Group Holding Ltd | 0.37% | 2/27/2025 |
| AIT UN | Applied Industrial Technologies Inc | 0.36% | 1/24/2025 |
| SSB UN | SouthState Corp | 0.35% | 1/23/2025 |
| RKLB UR | Rocket Lab USA Inc | 0.34% | 2/27/2025 |
| MLI UN | Mueller Industries Inc | 0.33% | 2/6/2025 |
| CRS UN | Carpenter Technology Corp | 0.32% | 1/30/2025 |
Technology Select Sector Index
| Ticker | Name | Weight in the Index | Expected Earnings Release |
| NVDA UW | NVIDIA Corp | 13.91% | 2/26/2025 |
| MSFT UW | Microsoft Corp | 12.83% | 1/30/2025 |
| AVGO UW | Broadcom Inc | 5.75% | 3/7/2025 |
| CRM UN | Salesforce Inc | 3.33% | 2/28/2025 |
| ORCL UN | Oracle Corp | 2.80% | 3/11/2025 |
| CSCO UW | Cisco Systems Inc | 2.51% | 2/14/2025 |
| NOW UN | ServiceNow Inc | 2.31% | 1/24/2025 |
| IBM UN | International Business Machines Corp | 2.20% | 1/29/2025 |
| AMD UW | Advanced Micro Devices Inc | 2.11% | 1/30/2025 |
| QCOM UW | QUALCOMM Inc | 1.89% | 1/31/2025 |
Energy Select Sector Index
| Ticker | Name | Weight in the Index | Expected Earnings Release |
| XOM UN | Exxon Mobil Corp | 22.53% | 2/3/2025 |
| CVX UN | Chevron Corp | 15.55% | 1/31/2025 |
| WMB UN | Williams Cos Inc/The | 4.63% | 2/14/2025 |
| EOG UN | EOG Resources Inc | 4.61% | 2/21/2025 |
| OKE UN | ONEOK Inc | 4.30% | 2/26/2025 |
| SLB UN | Schlumberger NV | 3.95% | 1/17/2025 |
| KMI UN | Kinder Morgan Inc | 3.91% | 1/17/2025 |
| PSX UN | Phillips 66 | 3.45% | 1/31/2025 |
| MPC UN | Marathon Petroleum Corp | 3.28% | 2/4/2025 |
| TRGP UN | Targa Resources Corp | 2.97% | 2/14/2025 |
Utilities Select Sector Index
| Ticker | Name | Weight in the Index | Expected Earnings Release |
| NEE UN | NextEra Energy Inc | 12.52% | 1/24/2025 |
| SO UN | Southern Co/The | 7.87% | 2/14/2025 |
| DUK UN | Duke Energy Corp | 7.23% | 2/7/2025 |
| CEG UW | Constellation Energy Corp | 6.45% | 2/27/2025 |
| VST UN | Vistra Corp | 4.57% | 2/28/2025 |
| SRE UN | Sempra | 4.49% | 2/27/2025 |
| D UN | Dominion Energy Inc | 3.94% | 2/21/2025 |
| PEG UN | Public Service Enterprise Group Inc | 3.66% | 2/26/2025 |
| PCG UN | PG&E Corp | 3.64% | 2/21/2025 |
| EXC UW | Exelon Corp | 3.31% | 2/12/2025 |
S&P Transportation Select Industry FMC Capped Index
| Ticker | Name | Weight in the Index | Expected Earnings Release |
| UNP UN | Union Pacific Corp | 16.76% | 1/23/2025 |
| UBER UN | Uber Technologies Inc | 16.27% | 2/7/2025 |
| UPS UN | United Parcel Service Inc | 11.04% | 1/30/2025 |
| UAL UW | United Airlines Holdings Inc | 4.72% | 1/21/2025 |
| FDX UN | FedEx Corp | 4.53% | 3/20/2025 |
| NSC UN | Norfolk Southern Corp | 4.43% | 1/29/2025 |
| CSX UW | CSX Corp | 4.43% | 1/23/2025 |
| DAL UN | Delta Air Lines Inc | 4.42% | 1/10/2025 |
| ODFL UW | Old Dominion Freight Line Inc | 4.08% | 1/31/2025 |
| LUV UN | Southwest Airlines Co | 3.10% | 1/30/2025 |
S&P Retail Select Industry Index
| Ticker | Name | Weight in the Index | Expected Earnings Release |
| GME UN | GameStop Corp | 1.60% | 3/26/2025 |
| WRBY UN | Warby Parker Inc | 1.58% | 2/28/2025 |
| ANF UN | Abercrombie & Fitch Co | 1.57% | 3/6/2025 |
| EBAY UW | eBay Inc | 1.55% | 2/27/2025 |
| CHWY UN | Chewy Inc | 1.54% | 3/20/2025 |
| URBN UW | Urban Outfitters Inc | 1.53% | 2/27/2025 |
| CART UW | Maplebear Inc | 1.53% | 2/13/2025 |
| ASO UW | Academy Sports & Outdoors Inc | 1.53% | 3/21/2025 |
| BOOT UN | Boot Barn Holdings Inc | 1.52% | 1/31/2025 |
| JWN UN | Nordstrom Inc | 1.49% | 3/5/2025 |
S&P Oil & Gas Exploration & Production Select Industry Index
| Ticker | Name | Weight in the Index | Expected Earnings Release |
| EQT UN | EQT Corp | 2.97% | 2/13/2025 |
| CTRA UN | Coterra Energy Inc | 2.95% | 2/21/2025 |
| OXY UN | Occidental Petroleum Corp | 2.93% | 2/18/2025 |
| FANG UW | Diamondback Energy Inc | 2.90% | 2/20/2025 |
| TPL UN | Texas Pacific Land Corp | 2.90% | 2/21/2025 |
| MTDR UN | Matador Resources Co | 2.89% | 2/20/2025 |
| EXE UW | Expand Energy Corp | 2.89% | 2/20/2025 |
| SM UN | SM Energy Co | 2.88% | 2/21/2025 |
| RRC UN | Range Resources Corp | 2.88% | 2/21/2025 |
| CHRD UW | Chord Energy Corp | 2.84% | 2/21/2025 |
S&P Regional Banks Select Industry Index
| Ticker | Name | Weight in the Index | Expected Earnings Release |
| TFC UN | Truist Financial Corp | 4.31% | 1/17/2025 |
| CFG UN | Citizens Financial Group Inc | 4.31% | 1/17/2025 |
| MTB UN | M&T Bank Corp | 4.24% | 1/16/2025 |
| HBAN UW | Huntington Bancshares Inc/OH | 4.23% | 1/17/2025 |
| RF UN | Regions Financial Corp | 4.19% | 1/17/2025 |
| FHN UN | First Horizon Corp | 3.69% | 1/16/2025 |
| WAL UN | Western Alliance Bancorp | 3.37% | 1/24/2025 |
| ZION UW | Zions Bancorp NA | 2.49% | 1/21/2025 |
| EWBC UW | East West Bancorp Inc | 2.29% | 1/23/2025 |
| SNV UN | Synovus Financial Corp | 2.25% | 1/15/2025 |
Dow Jones U.S. Select Aerospace & Defense Index
| Ticker | Name | Weight in the Index | Expected Earnings Release |
| GE UN | General Electric Co | 18.19% | 1/23/2025 |
| RTX UN | RTX Corp | 14.95% | 1/28/2025 |
| BA UN | Boeing Co/The | 12.61% | 1/28/2025 |
| TDG UN | TransDigm Group Inc | 4.66% | 2/7/2025 |
| GD UN | General Dynamics Corp | 4.50% | 1/24/2025 |
| HWM UN | Howmet Aerospace Inc | 4.46% | 2/13/2025 |
| NOC UN | Northrop Grumman Corp | 4.44% | 1/30/2025 |
| LMT UN | Lockheed Martin Corp | 4.24% | 1/28/2025 |
| LHX UN | L3Harris Technologies Inc | 4.12% | 1/30/2025 |
| AXON UW | Axon Enterprise Inc | 4.03% | 2/27/2025 |
NYSE FANG+ Index
| Ticker | Name | Weight in the Index | Expected Earnings Release |
| NVDA UW | NVIDIA Corp | 10.70% | 2/26/2025 |
| GOOGL UW | Alphabet Inc | 10.25% | 1/30/2025 |
| META UW | Meta Platforms Inc | 10.09% | 1/31/2025 |
| CRWD UW | Crowdstrike Holdings Inc | 10.06% | 3/5/2025 |
| NFLX UW | Netflix Inc | 9.79% | 1/21/2025 |
| NOW UN | ServiceNow Inc | 9.78% | 1/24/2025 |
| MSFT UW | Microsoft Corp | 9.59% | 1/30/2025 |
*Definitions and Index Descriptions
For more news, information, and strategy, visit the Leveraged & Inverse Channel.
Index Descriptions
- S&P 500® Index (SPXT) – Standard & Poor’s® selects the stocks comprising the S&P 500® Index (SPXT) on the basis of market capitalization, financial viability of the company and the public float, liquidity and price of a company’s shares outstanding. The Index is a float-adjusted, market capitalization-weighted index.
- S&P 500® High Beta Index (SP5HBIT) – Provided by S&P Dow Jones Indices (the “Index Provider”), which selects 100 securities to include in the Index from the S&P 500® Index that have the highest sensitivity to market movements, or “beta” over the past 12 months as determined by the Index Provider. Securities with the highest beta are generally the most volatile securities of the S&P 500® Index.
- Financial Select Sector Index (IXMTR) – Provided by S&P Dow Jones Indices and includes securities of companies from the following industries: Banks; Thrifts & Mortgage Finance; Diversified Financial Services; Consumer Finance; Capital Markets; Insurance; and Mortgage Real Estate Investment Trusts (REITs).
- Health Care Select Sector Index (IXVTR) – Provided by Standard & Poor’s and includes domestic companies from the healthcare sector, which includes the following industries: pharmaceuticals; health care equipment and supplies; health care providers and services; biotechnology; life sciences tools and services; and health care technology.
- Industrials Select Sector Index (IXITR) – Provided by S&P Dow Jones Indices and includes domestic companies from the industrials sector which includes the following industries: aerospace and defense; industrial conglomerates; marine; transportation infrastructure; machinery; road and rail; air freight and logistics; commercial services and supplies; professional services; electrical equipment; construction and engineering; trading companies and distributors; airlines; and building products.
- Real Estate Select Sector Index (IXRETR) – Provided by S&P Dow Jones Indices (the “Index Provider”) and includes securities of companies from the following industries: real estate management and development and real estate investment trusts (“REITs”), excluding mortgage REITs.
- Dow Jones Internet Composite Index (DJINETT) – Provided by S&P Dow Jones Indices and includes companies that generate at least 50% of their annual sales/revenue from the internet as determined by the Index Provider. Additionally, each stock must have a minimum of three months’ trading history and a three month average market capitalization of at least $100 million. The Index consists of 40 stocks from two different sectors, internet commerce and internet services
- S&P Biotechnology Select Industry Index (SPSIBITR) – Provided by S&P Dow Jones Indices LLC and includes domestic companies from the biotechnology industry. The Index is a modified equal – weighted index that is designed to measure the performance of the biotechnology sub-industry based on the Global Industry Classification Standards (GICS).
- NYSE Semiconductor Index (ICESEMIT) – A rules-based, modified float-adjusted market capitalization-weighted index that tracks the performance of the thirty largest U.S. listed semiconductor companies.
- Dow Jones U.S. Select Home Construction Index (DJSHMBT) – Measures U.S companies in the home construction sector that provide a wide range of products and services related to homebuilding, including home construction and producers, sellers and suppliers of building materials, furnishings and fixtures and also home improvement retailers. The Index may include large-, mid- or small-capitalization companies.
- NASDAQ 100® Equal Weighted Index (NETR) – Includes 100 of the largest non-financial securities listed on NASDAQ®, but instead of being weighted by market capitalization, each of the constituents is initially set at 1.00%.
- S&P Mid Cap 400® Index (SPTRMDCP) – Measures the performance of 400 mid-sized companies in the United States. The Index is a free-float adjusted market capitalization-weighted index composed of liquid common stocks.
- Russell 2000® Index (RU20INTR) – Measures the performance of approximately 2,000 small-capitalization companies in the Russell 3000® Index, based on a combination of their market capitalization.
- Technology Select Sector Index (IXTTR) – Provided by S&P Dow Jones Indices and includes domestic companies from the technology sector which includes the following industries: computers and peripherals; software; diversified telecommunications services; communications equipment; semiconductors and semi-conductor equipment; internet software and services; IT services; electronic equipment, instruments and components; wireless telecommunication services; and office electronics.
- Energy Select Sector Index (IXETR) – Provided by S&P Dow Jones Indices and includes domestic companies from the energy sector which includes the following industries: oil, gas and consumable fuels; and energy equipment and services.
- Utilities Select Sector Index (IXUTR) – Provided by S&P Dow Jones Indices and includes domestic companies from the utilities sector which includes the following industries: electric utilities; multi-utilities; water utilities; independent power producers and energy trades; and gas utilities.
- S&P Transportation Select Industry FMC Capped Index (SPTSCUT) – Provided by S&P Dow Jones Indices and is designed to measure stocks in the S&P Total Market Index that are included in the GICS transportation sub-industry.
- S&P Retail Select Industry Index (SPSIRETR) – A modified equal-weighted index that is designed to measure performance of the stocks comprising the S&P Total Market Index that are classified in the Global Industry Classification Standard (GICS) retail sub-industry.
- S&P Oil & Gas Exploration & Production Select Industry Index (SPSIOPTR) – Provided by Standard & Poor’s Index Provider and includes domestic companies from the oil and gas exploration and production sub industry. The Index is a modified equal weighted index that is designed to measure the performance of a sub industry or group of sub industries determined based on the Global Industry Classification Standards (GICS).
- S&P Regional Banks Select Industry Index (SPSIRBKT) – A modified equal-weighted index that is designed to measure performance of the stocks comprising the S&P Total Market Index that are classified in the Global Industry Classification Standard (GICS) regional banks sub-industry.
- Dow Jones U.S. Select Aerospace & Defense Index (DJSASDT) – Provided by Dow Jones U.S. Index (the “Index Provider”). The Index attempts to measure the performance of the aerospace and defense industry of the U.S. equity market. The Index Provider selects the stocks comprising the Index from the aerospace and defense sector on the basis of the float-adjusted, market capitalization-weight of each constituent. Aerospace companies include manufacturers, assemblers and distributors of aircraft and aircraft parts. Defense companies include producers of components and equipment for the defense industry, such as military aircraft, radar equipment and weapons.
- NYSE FANG+ Index (NYFANGT) – An equal-dollar weighted Index designed to track the performance of 10 highly-traded growth stocks of technology and tech-enabled companies. The Index is comprised of the securities of U.S.-listed companies that ICE Data Indices, LLC (the “Index Provider”) has identified as FANG+ companies, which are comprised of the six FAANMG companies and four non-FAANMG companies. The Index Provider defines the FAANMG as Meta Platforms Inc. (META), Apple Inc. (AAPL), Amazon.com Inc. (AMZN), Netflix Inc. (NFLX), Microsoft Corp. (MSFT), and Alphabet Inc. Class A (GOOGL). The Index is reconstituted quarterly.
Distributor: ALPS Distributors, Inc.
