
As we move through 2024, the U.S. finds itself at a fascinating economic crossroad. The aftermath of the COVID-19 pandemic, coupled with unprecedented fiscal and monetary policies, has created a unique economic environment filled with both challenges and opportunities.
The second half of this year promises to be particularly intriguing with the upcoming election and U.S. Federal Reserve (Fed) monetary policy decisions taking center stage. Considering that Congress is close to evenly divided at this point, we do not think either party will be able to pass significant legislation. History shows that most presidential elections have little impact on the economy and markets beyond near-term uncertainty. We do see some real risks to the economy, especially in the forms of Fed policy, fiscal deficits, and federal government debt. Regardless of who wins in November, the leadership in Washington, DC. will likely be grappling with deficit and debt issues for a least the next few election cycles.
Despite potential headwinds, our work suggests that the U.S. stands on the threshold of an innovation boom. A host of potentially transformative technologies may usher in a new era of growth and prosperity driven primarily by the private sector with little need for the federal government to do much of anything. As we outline below, beyond the near-term vulnerabilities, the coming years hold incredible opportunities for our economy and across the financial markets.
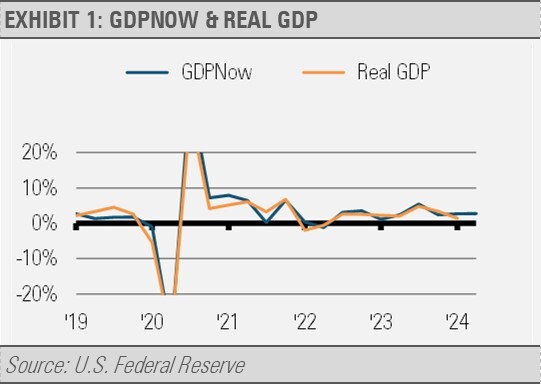
Current economic indicators paint a picture of slower but persistent growth. The Atlanta Fed’s GDP Now forecast suggests a moderating pace of expansion (exhibit 1). At the same time, it looks like the pandemic era excess household savings have finally been depleted, which may keep economic growth muted.
We can also see inflationary pressures declining. This does not mean that prices will necessarily fall back to pre-pandemic levels, but that the rate of inflation will likely continue to decline closer to the Fed’s target. We believe it is important to identify the current key drivers of inflation as either demand, supply, or monetary policy driven. The latest bout of inflation was driven by a spike in demand that drove prices higher. This spike in demand was primarily caused by excess pandemic-era stimulus programs.
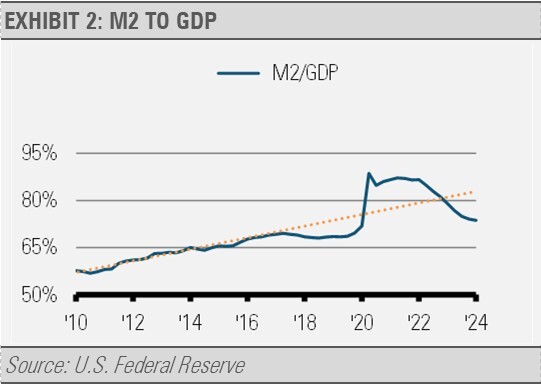
We can see the amount of money in the economy, as measured by M2, spike to above the pre-pandemic trend as measured both in absolute terms and relative to the size of the economy. The recent reversal of these trends eases the inflationary impulse.
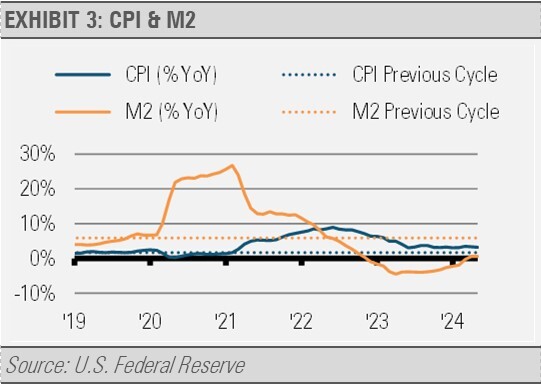
While the previous business cycle saw Consumer Price Index (CPI) inflation averaging less than 2% per year, we may see somewhat higher inflation this turn as deglobalization and the domestic industrial buildout leads to more pricing pressures than during the previous business cycle. That may mean that CPI settles in at 2.5%-3.0% per year like we saw in the 1990s and early 2000s, but not likely a repeat of the 1970s. Note that the former two periods experienced excellent U.S. equity market returns.
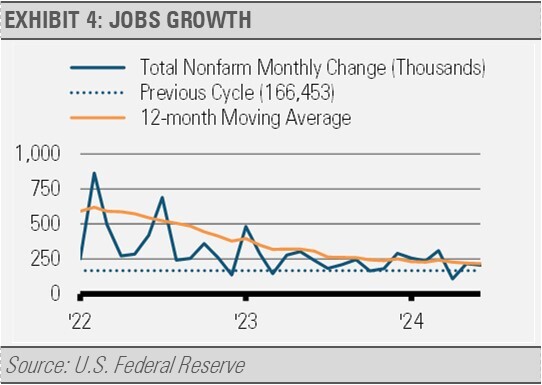
Similarly, we are seeing the pace of jobs creation slow to a pace closer to longer-term trends. After initially collapsing with the pandemic-related economic shutdown, monthly jobs creation spiked as the economy reopened and economic growth accelerated at a blistering pace. In fact, jobs creation eventually more than made up for the ground lost during the pandemic. Recent reports show monthly jobs gains slowing towards the previous business cycle average of 166,453 new jobs per month.
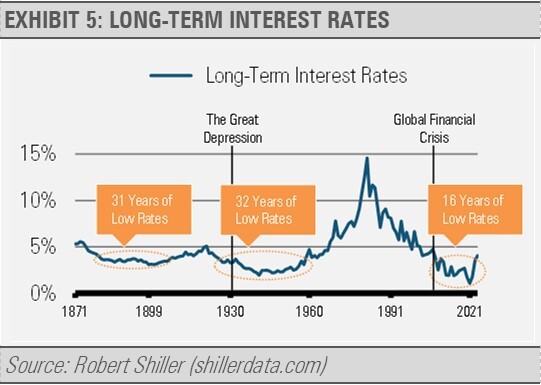
While we may see some volatility around interest rates as global central banks adjust their policy rates, developed market governments continue to run large fiscal deficits that will likely lead to additional bond issuance and put upward pressure on long-term interest rates, though a repeat of the 1970s spike in long-term interest rates is highly unlikely. As you can see from the graph below with data going back to 1870, despite the years of economic and geopolitical turmoil including the Great Depression and World War II, the 1970s were an anomaly that is unlikely to be repeated.
INVESTMENT IMPLICATIONS
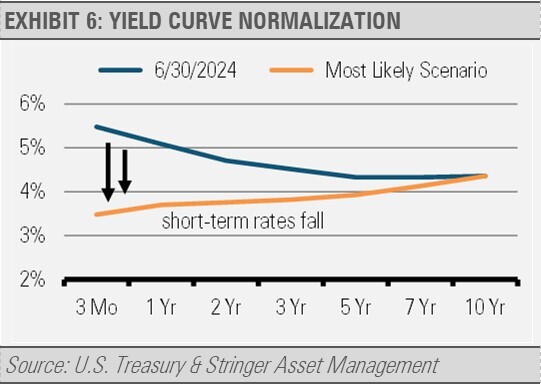
History suggests that interest rates will eventually adjust such that long-term rates will be higher than short-term rates, and lead to a normalization of the yield curve. While there are several ways the yield curve may eventually normalize, we think that the most likely scenario is that inflation falls slowly in fits and starts while economic data continues to soften prompting the Fed to ease. This scenario would eventually bring short-term rates down at a muted pace as the Fed would be reluctant to reduce short-term interest rates too quickly. With longer-term rates close to fairly priced, we expect long rates to anchor near current levels as illustrated below. Under this scenario, we think that high quality, intermediate duration fixed income with a focus on defined maturities can allow investors to lock-in today’s attractive income levels while mitigating interest rate risk and reinvestment risk.
We have seen a continuation of the narrow equity market leadership stretching valuations further this year. Our work and history suggest there are several ways that the narrow equity market will eventually normalize, and market participation will continue to broaden. Based on our scenario outlined above for yield curve normalization, we may see an economic soft patch leading to equity market volatility. We would view this as a buying opportunity in companies with more resilient earnings streams and stronger balance sheets than the overall equity market. This segment of the market is better positioned to withstand the pressures of still tight monetary policy, rising debt, and a deterioration of consumer spending.
We think that what comes next is great news for the next U.S. business cycle. With the Fed eventually normalizing monetary policy and the government necessarily getting its fiscal house in order, the private sector will be left to drive the economy and the financial markets.
While the pandemic-era excess savings may have been depleted, U.S. household finances remain generally robust. Homeowners that secured low-interest, fixed-rate mortgages during the recent years of historically low rates are particularly well-positioned. These favorable loan terms will continue to benefit millions of Americans for decades to come and provide a stable foundation for household finances even as interest rates have risen significantly. Massive private sector investment in plant and equipment as well as research and development are poised to lead to increased domestic production and innovation-led productivity growth.
Looking ahead, the economic path may not be entirely smooth. We may experience periods of volatility, particularly in the equity markets. However, the underlying strength of the U.S. private sector provides a solid foundation for weathering these potential challenges.
For investors, this environment suggests a focus on quality. High-quality equities and fixed-income investments in the intermediate part of the yield curve are likely to offer the best risk-adjusted returns. While short-term market fluctuations may occur, disciplined investors that can withstand some volatility should benefit from the ongoing wave of innovation and business investment.
While uncertainties persist, particularly around the upcoming election and global economic conditions, the U.S. economy appears poised for a period of transformative growth. The combination of robust R&D spending, manufacturing resurgence, and generally healthy household finances creates fertile ground for innovation and economic expansion. As we navigate through 2024 and beyond, those who remain informed and adaptable will be best positioned to capitalize on the opportunities that lie ahead in this evolving economic landscape.
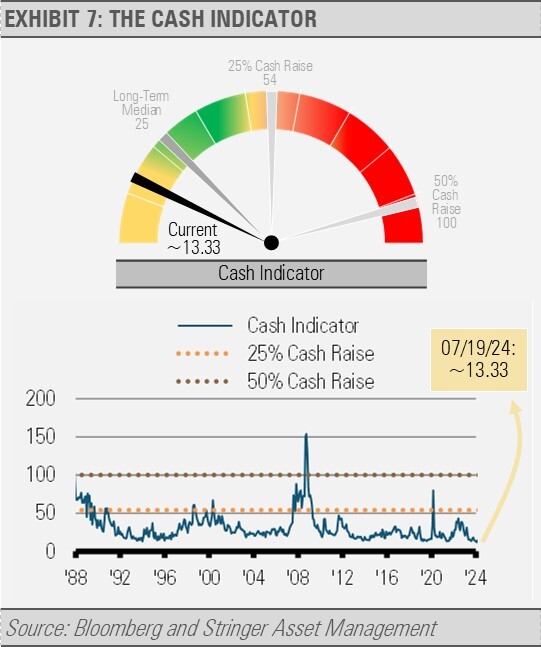
CASH INDICATOR
The Cash Indicator (CI) remains well below historical norms as daily equity market volatility continues at some of the lowest levels on record. Similarly, credit spreads remain tight. Combined, these data suggest market complacency that can be disrupted at any time, especially around the upcoming election.
With a favorable economic backdrop, we think that investors should be poised to use equity market volatility as an opportunity to add to quality positions.
For more news, information, and analysis, visit the ETF Strategist Channel.
DISCLOSURES
Any forecasts, figures, opinions or investment techniques and strategies explained are Stringer Asset Management, LLC’s as of the date of publication. They are considered to be accurate at the time of writing, but no warranty of accuracy is given and no liability in respect to error or omission is accepted. They are subject to change without reference or notification. The views contained herein are not to be taken as advice or a recommendation to buy or sell any investment and the material should not be relied upon as containing sufficient information to support an investment decision. It should be noted that the value of investments and the income from them may fluctuate in accordance with market conditions and taxation agreements and investors may not get back the full amount invested.
Past performance and yield may not be a reliable guide to future performance. Current performance may be higher or lower than the performance quoted.
The securities identified and described may not represent all of the securities purchased, sold or recommended for client accounts. The reader should not assume that an investment in the securities identified was or will be profitable.
Data is provided by various sources and prepared by Stringer Asset Management, LLC and has not been verified or audited by an independent accountant.
