
In stark contrast to 2022, the market is starting to “feel” a bit more normal. Fewer and fewer “outlier” days are occurring. An outlier day is any trading day for the S&P 500 that is beyond +/-1.50% and is considered a sign of high emotion or irrationality among investors. Last year, the major market index, or S&P 500, experienced an outlier day once every three trading days on average. This year, the market has only seen an outlier once every two and a half weeks. Most of those outliers occurred in a cluster during March. It has now been nineteen trading days since the last outlier day.
Given the declining number of outlier days, which correlates directly with the current declining market volatility, it might appear that the market is becoming more “efficient” and that risk is reduced. The reality, however, is that the market is in a battle on two fronts. Neither front is secure nor safe.
Read more: “A Distorted Market“
Front #1: Technology Stocks
Let’s start with the front that is holding the markets together: Technology. If you have read any of our commentaries this year, you will know that technology stocks have been by far and away the best performing group in 2023. Large technology stocks, like Meta (Facebook) and Nvidia have seen their share prices more than double in 2023. Other large tech names like Apple, Microsoft, and Google have experienced sharp, fast, and most likely unsustainable increases over the last few months. The best way to describe these similar looking charts is that they all have experienced a sharp, “parabolic” increase in price.
Technology stocks were some of the hardest hit and underperforming stocks in 2022. Now, they have been some of the best performers in 2023. The stocks named in the paragraph above happen to be some of the largest stocks in the S&P 500: five company stocks accounting for 23% of index’s market capitalization. On average, in 2022, these stocks were down -42%. Now, this year, each one of these individual company stocks is up anywhere from +39% to +160% in 2023.
A rise of 40% plus, or significantly more in the case of Meta and Nvidia, in just five months is just as rational and efficient as the significant decline that these stocks experienced last year. So here is where the battle is being fought: Will that sharp rise continue? Or will these steep increases eventually end the same way as every other parabolic curve: another sharp move in the opposite direction?
Front #2: Every Other Market Segment
On one front, the Market is “riding a wild a bull” in a few stocks and could be bucked off at any time. On the second front, it is losing a battle that is getting worse.
The S&P 500 has eleven sectors. The sector performance in 2023 is almost the exact opposite of what it was in 2022. The worst performing sectors from last year have been 2023’s best performers, while last year’s top dogs scrape the bottom of the barrel this year. There has been a severe disparity in how market segments have performed.
The three technology-heavy sectors (information technology, communications, and consumer discretionary) are each up anywhere from 20% to 35% on the year. Not a single other of the eight remaining sectors are up more than 3% year-to-date, and six of them are actually down.
Of the S&P 500’s largest 150 stocks (accounting for roughly 78% of the index’s capitalization), twice as many stocks are showing “sell” signals as there are showing “buy” signals, according to Canterbury’s combination of technical indicators. Additionally, all sectors besides technology and communications have more sells than buys. On this front, the market is up against several weakening stocks.
How Does the Battle End?
So, you have a battle being fought on two fronts. On one front, you have technology stocks holding the market afloat. Tech stocks are experiencing sharp, parabolic advance that follows a sharp decline from last year. On the other front, you have virtually every other market sector flat to down year-to-date. Many of these stocks are showing bearish characteristics.
The result of this two-front battle has been a sideways or even slightly upward moving market since February. The largest technology names experienced sharp rises and have held the market up, while most other stocks have fallen off. In other words, the generals (large tech) are out in front leading the charge, while the fallen troops falling back. You can see this in the chart of the S&P 500 and the Advance-Decline Line of the S&P 1500 stocks. The AD line measures the number of advancing issues versus declining ones.
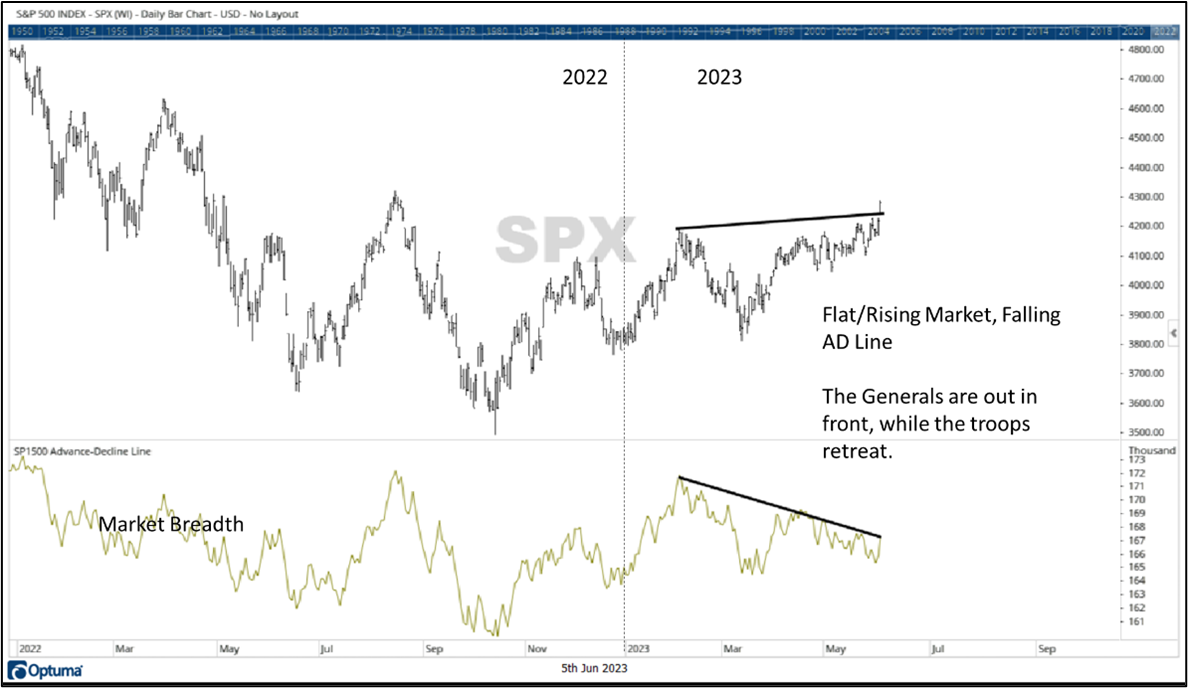
Source: Canterbury Investment Management. Chart created using Optuma Technical Analysis Software
The war will be won or lost when one of two things happens. Either the weaker stocks will have to play a game of catch-up, and a rising tide will lift all ships, or the large technology stocks (the generals) will follow the troops and fall back.
Bottom Line
The market is in a vulnerable place. Of the two aforementioned scenarios, technology stocks are more likely to falter, than a large basket of securities are to play a game of catch-up. As with all parabolic advances, the timing as to which they end and the extent of the damage they may see, is unknown. Technology stocks could continue to outperform but in the majority of cases, a sharp rebound will be followed by a sharp decline.
Fortunately, investors have all the tools they need to be successful. Being successful in markets is not about predicting where the next hot area will be, or when stocks might decline. Being successful is about adapting to the current environment at hand while being ready to shift to a new market environment when it changes. That is why at Canterbury, we use an adaptive process, called the Canterbury Portfolio Thermostat. The Thermostat is designed to rotate portfolio holdings and adjust its asset allocation, in order to move in concert with ever-changing market environments- bull or bear.
For more news, information, and analysis, visit the ETF Strategist Channel.
