
By Jeremy Schwartz, CFA & Bradley Krom, WisdomTree.
What started out as a thought experiment proposed by Cliff Asness in the late ’90s evolved into one of the most effective crowdsourced ideas in ETF product development history.
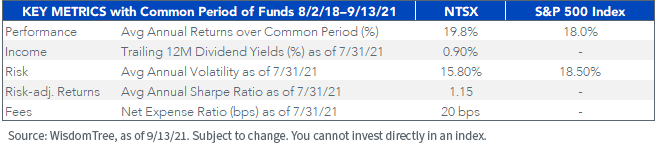
Leveraging the historical inverse relationship between U.S. equities and U.S. bond returns and providing a capital efficient combination of 90% equities and 60% bond futures “stacked on top,”1 WisdomTree created a strategy—the WisdomTree U.S. Efficient Core Fund (NTSX)—that has delivered higher cumulative returns than the S&P 500 Index with lower volatility and smaller drawdowns since its inception in August 2018.
While there are no guarantees in investing, we are confident this approach can continue to add diversification value to the core of portfolios.
Cumulative Returns
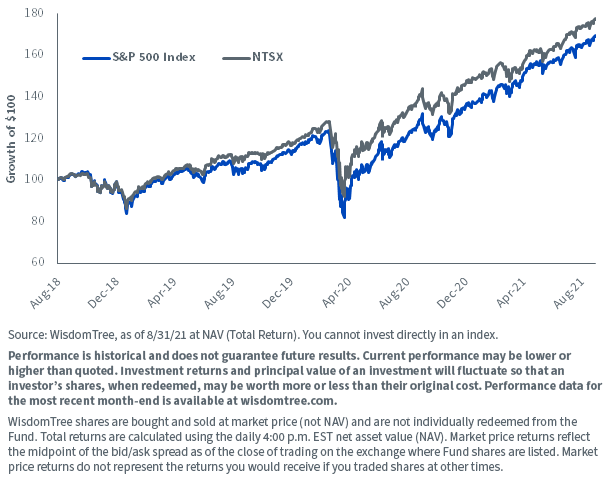
For standardized performance of NTSX, please click here.
For definitions of terms in the charts, please visit our glossary.
Another way to quickly summarize the past performance, with three years of data now available, NTSX was awarded 5 stars from Morningstar, putting it near the top of the large cap blend category. Based on risk adjusted returns as of 8/31/21 out of 1,254 funds for the large cap blend category for the 3 year period.
Morningstar’s Risk dashboard shows key statistics from the last three years of live data:
- NTSX ranked in the lowest risk bucket of funds in the large blend category.
- NTSX ranked in the top decile of funds based on risk adjusted returns for performance in the large blend category.
- NTSX had a beta of 0.84, illustrating the lower risk dynamics (and less than the 90% allocation to equities, showing the bond diversification value).
- With 90% up capture and 74% down capture, while the Morningstar category average for large blend was 96% upside but 102% downside capture.
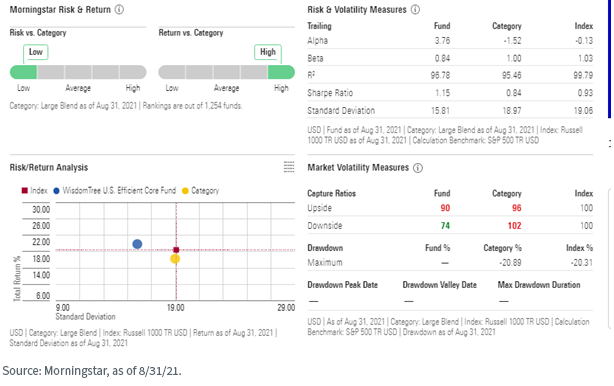
For definitions of terms in the image, please visit our glossary.
What Could Go Wrong: Rising Yields and Falling Stocks
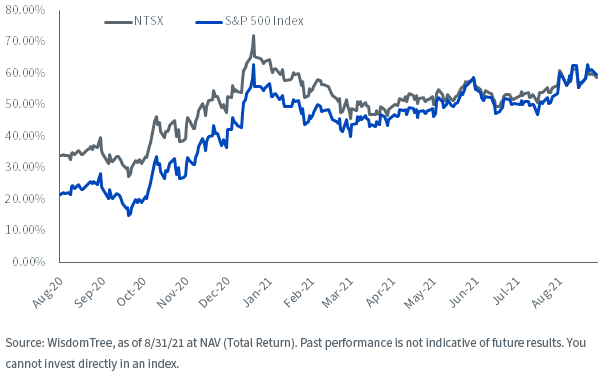
While clearly an environment of rising bond yields and falling stocks would be the worst outcome for absolute returns of NTSX, we’ve had a mini episode of that in the last three years, and NTSX has still tended to outperform long-only equity exposures.
This is primarily driven by the fact that losses on fixed income have historically tended to be smaller in magnitude than losses from equities. The net result may continue to be a less bumpy ride when equities swoon.
Trailing 2-Year Return
Current Market Challenges
Many investors are struggling with the lower expected returns in both stocks and bonds—with bond yields near historical lows and equity valuations near highs.
Fears of inflation have been rising—and investors are looking for strategies that might diversify either market volatility late in this bull cycle or inflation risk from all the money printing that has occurred around the world.
The challenge with adding assets like gold or commodities to portfolios: where do you fund the allocations from? Commodities might provide an inflation hedge to preserve purchasing power, but they do not provide the “risk-off feature” that bonds provide in a traditional market sense.
Utilizing capital-efficient strategies like NTSX at the core of equity allocations creates room to “stack on” any diversifying strategies—be it gold, commodities, managed futures or any creative alpha-oriented strategy seeking to add to returns or lower overall portfolio risk.
To illustrate this return stacking idea with an example:
- Swapping the Efficient Core NTSX for 10% traditional equities in a portfolio frees up space to trim traditional bond fund allocations by 6%, and then one can use that 6% to allocate to any return stream one wants to stack on top of their original allocations.
- Specifically, at our 90/60 combination of stocks and bonds, the 10% swap results in 9% allocation to stocks and 6% to bond futures. Without trimming bond allocations, a 10% equity position swap with NTSX would result in a 1% lower equity allocation and 6% additional bond futures exposure.
- Managed futures strategies could be an ideal portfolio complement to a capital efficient core fund like NTSX due to managed futures’ historical ability to provide tactical hedges and short exposure to the markets.
- Other Efficient Core complements could be:
- Further income-oriented allocations to potentially increase portfolio income
- Other high-growth thematics if focused on capital appreciation mandates
Conclusion
We believe our Efficient Core suite delivers significant innovation to the market and helps investors get creative in their portfolio design and optimization.
Now with more than $600 million of assets and a three-year live history, we see the time as ripe to reconsider how NTSX could enhance your portfolio.
Watch our latest video on Efficient Core Suite below.
1. Corey Hoffstein, one of the advocates for a capital-efficient portfolio approach and who was quoted in Barron’s about the need for such strategies ahead of our launch, recently penned a paper outlining the concept of return stacking in “Return Stacking: Strategies for Overcoming a Low Return Environment” with two colleagues at ReSolve Asset Management.
Originally published by WisdomTree, September 16, 2021.
Important Risks Related to this Article
This information must be preceded or accompanied by a prospectus; click here to view or download prospectus. We advise you to consider the Fund’s objectives, risks, charges and expenses carefully before investing. The prospectus contains this and other important information about the Fund. Please read the prospectus carefully before you invest.
There are risks associated with investing, including possible loss of principal. While the Fund is actively managed, the Fund’s investment process is expected to be heavily dependent on quantitative models, and the models may not perform as intended. Equity securities, such as common stocks, are subject to market, economic and business risks that may cause their prices to fluctuate. The Fund invests in derivatives to gain exposure to U.S. Treasuries. The return on a derivative instrument may not correlate with the return of its underlying reference asset. The Fund’s use of derivatives will give rise to leverage, and derivatives can be volatile and may be less liquid than other securities. As a result, the value of an investment in the Fund may change quickly and without warning, and you may lose money. Interest rate risk is the risk that fixed income securities, and financial instruments related to fixed income securities, will decline in value because of an increase in interest rates and changes to other factors, such as perception of an issuer’s creditworthiness. Please read the Fund’s prospectus for specific details regarding the Fund’s risk profile.
For each fund with at least a three-year history, Morningstar calculates a Morningstar RatingTM metric each month by subtracting the return on a 90-day U.S. Treasury Bill from the fund’s load-adjusted return for the same period and then adjusting this excess return for risk. The top 10% of the funds in each broad asset class receive five stars, the next 22.5% receive four stars, the next 35% receive three stars, the next 22.5% receive two stars and the bottom 10% receive one star. The Overall Morningstar RatingTM for a fund is derived from a weighted average of the performance figures associated with its three-, five- and ten-year (if applicable) Morningstar RatingTM metrics. The WisdomTree U.S. Efficient Core Fund (NTSX) was rated against the following number of U.S.-domiciled large-cap blend funds over the following time periods: 1,254. With respect to these large-cap blend funds, the WisdomTree U.S. Efficient Core Fund (NTSX) received a Morningstar RatingTM of five stars for the three-year period. Past performance is no guarantee of future results.
Morningstar Quartile Rankings are based on Morningstar Percentile Ranking in Morningstar Category, where 1% – 25% = first quartile(1); 26% – 50% = second quartile(2); 51% – 75% = third quartile(3); and 76% – 100% = fourth quartile(4). The Morningstar Percentile Ranking compares a Fund’s Morningstar risk and return scores with all the Funds in the same Category, where 1% = Best and 100% = Worst.
Morningstar Risk is an assessment of the variations in a fund’s monthly returns in comparison to similar funds. The greater the variation, the larger the risk score.
Morningstar Return is an assessment of the fund’s excess return over a risk-free rate (the return of the 90-day Treasury bill) in comparison to similar funds.
© [2021] Morningstar. All Rights Reserved. The information contained herein: (1) is proprietary to Morningstar and/or its content providers; (2) may not be copied or distributed; and (3) is not warranted to be accurate, complete or timely. Neither Morningstar nor its content providers are responsible for any damages or losses arising from any use of this information.
