
We are officially half-way through 2021 and by all measures markets are weird and getting weirder. (NB, “weird” is a term we credentialed CFA luminaries use to describe events we just can’t fully get our heads around.) The on-going tug-of-war being played out between the markets and the US Federal Reserve has altered our expected notion of probable outcomes, replacing analysis and insight with the equivalent of dart-throwing. It’s no small frustration on our part to have our clients fortunes at the mercy of an increasingly activist and quite possibly politically minded central bank.
The year so far has been kind to investors of all stripes. While interest rates have risen consistent with the re-opening of the global economy, the Fed has managed to perfectly walk the high wire, balancing its overt desire for higher inflation with a promise not to raise short-term interest rates anytime soon. The US economy has played its part as well, rebounding strongly as vaccinations take hold and what we used to take for granted (shopping, travel, dining-out) becomes the norm once again.
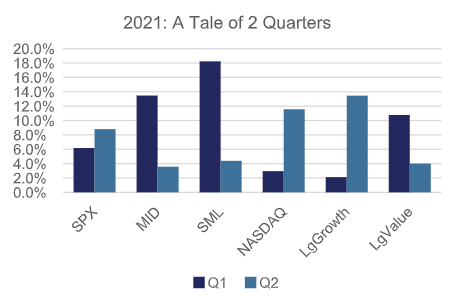
Chart source: Bloomberg, Nottingham Advisors
One would likely have better luck at the casino than trying to predict daily winners and losers in the equity market. Through all the recent vicissitudes, however, one guidepost that remains reliable is the US corporate earnings scorecard. From 2019’s $157 per share, S&P 500 operating earnings plummeted -22% to $122 in 2020 as the pandemic took hold. As we go to press, analyst estimates for 2021 hover just around $200 per share, or up 63% versus last year. This would put the S&P 500 at 21.4x current year earnings, a full multiple to be sure, but consistent with rock-bottom interest rates and expectations for further earnings growth in 2022 of 5-10% or so. As we learned with the recent pandemic though, it doesn’t pay to get to far ahead of one’s self as the next “black swan” could be just around the corner.
The real topic on the minds of investors in the second quarter might be summed up as, What is the Fed thinking? Chair Powell went to great lengths to reassure investors that his was not an itchy trigger finger, and that the Fed would remain accommodative even in the face of higher inflation. Well, higher inflation is upon us, and thus far the Fed is sticking with its “transitory” story. The market is certainly buying what the Fed is selling as the yield on the 10-year Treasury hovers near 1.37%, despite the latest CPI print showing a 5.0% YoY rise in prices.
Away from US equities, returns have been mixed through the first half of the year. International developed markets have been steady, paced by the Euro area (+14.4% in Euro, +11.3% in USD), while emerging markets have been hampered by China’s more recent but continuing crack down on large technology companies. The Chinese stock market is roughly flat YTD while Korea is up nearly 15% and Taiwan over 20%.
International equities have held up well in 2021, despite many countries further behind on the re-opening curve. The Euro-area remains cheap on a P/E basis, and with a heavy weighting in financials, should benefit from higher interest rates. China’s crackdown on large tech has hurt equity returns, despite a growing tail wind from supply chain disruptions. Commodity prices have surged in 2021, which is often beneficial for many EM countries. Bonds have lagged while domestic real estate is strong.
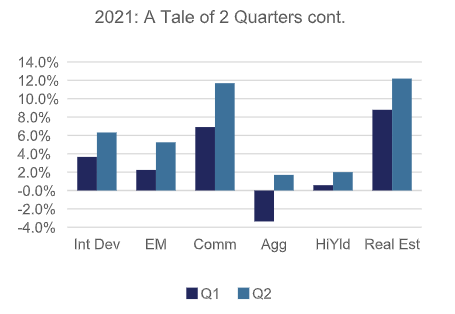
Chart source: Bloomberg, Nottingham Advisors
Interest rates in the US have drifted higher since the start of the year, despite the Fed’s continued buying of $120 billion per month in Treasuries and mortgage-backed securities. Starting the year with a .91% yield, the benchmark US 10-year Treasury note saw a high print of 1.74% to close out Q1, before rising prices drove yields down to todays 1.37%. The 30-year Treasury bond saw its yield rise from a January low of 1.65% to a high of 2.45% in March, before it too fell to today’s 2.00%. Should the current spate of price increases prove to be anything but transitory, we will likely see measurably higher rates in the not-to-distant future.
So where to from here? The inflation question, in our minds, is really critical. Unfortunately, we won’t know until we’re further down the road whether the ongoing rise in prices is permanent or indeed transitory. If permanent, risk assets will need to be repriced with higher discount rates (that’s CFA-speak for stock and bond prices will fall). As the chart below illustrates, there is a negative correlation between the rate of inflation and the multiple of earnings that investors are willing to pay for stocks. The higher the inflation rate, the lower the P/E, ceteris paribus.
As the rate of inflation edges up, equities have historically traded at lower P/E multiples. The rise in bond yields reduces the present value of asset prices, including future corporate earnings. The current P/E on the S&P is 21.5x expected 2021 earnings. This is high relative to history, but consistent with an ultra-low interest rate environment.
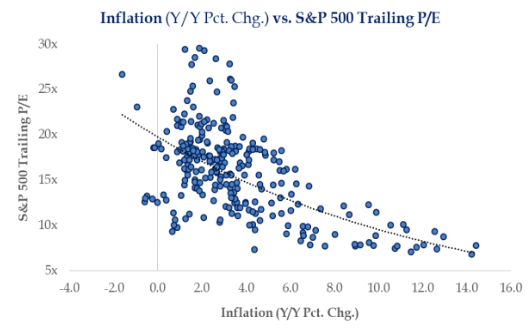
Chart source: Strategas Research Partners
The ushering in of higher interest rates and lower P/E multiples would imply lower expected returns over the coming years. Recent domestic equity returns have been far above longer-term averages, while bond returns have largely trailed the longer-term mean. This is by no means a signal to exit risk assets, merely a warning that we may be entering a period of below-average asset class returns, following a long period of above average performance.
Much of what is taking place is unprecedented, or at least rare. The pandemic, quantitative easing, massive debt-based fiscal spending, it’s all without much in the way of precedent, which makes it more difficult to accurately handicap potential outcomes. Given that forecasting is part of our job, we’re spending a lot of time these days discussing and handicapping possible outcomes, and trying to position your portfolio to maximize the return available while being mindful of downside risk.
As we’ve suggested in previous notes, Nottingham’s portfolios are built around diversification and for the better part of the past 5 years, we feel that hasn’t been rewarded or appreciated. Outsized returns have been largely concentrated within domestic equities, and within that sphere, large-cap tech companies. Despite enviable earnings growth rates, much of that return has been multiple expansion. Whether it be Microsoft (37x TTM), Apple (31x TTM), Amazon (65x TTM) or Nvidia (83x TTM), the main drivers of return boil down to investors chasing growth at all costs, much like they did in the late ‘90’s.
While we do think interest rates could move a bit higher in the near term, we don’t anticipate a year 2000 style correction in equities just yet. A key component of the risk asset tailwind has been fiscal policy, beginning with 2017’s Tax Cuts and Jobs Act, right on through to 2020’s massive pandemic relief legislation that continues to this day. Fiscal policy, built on ever-increasing debt, has boosted the US economy and prevented what could have been a more serious economic decline following the onset of the pandemic. The on-going debate today over a trillion-dollar plus infrastructure-spending bill only adds to the potential for government stimulus in the years ahead.
Interest rates were trending higher pre-pandemic, before the Fed took extraordinary measures to protect the US economy. It is currently buying $120 billion per month of Treasury and MBS in an effort to ensure liquidity and low interest rates. With the housing market running hot, one could question the need for this. The Fed Funds rate remains anchored at 0%.
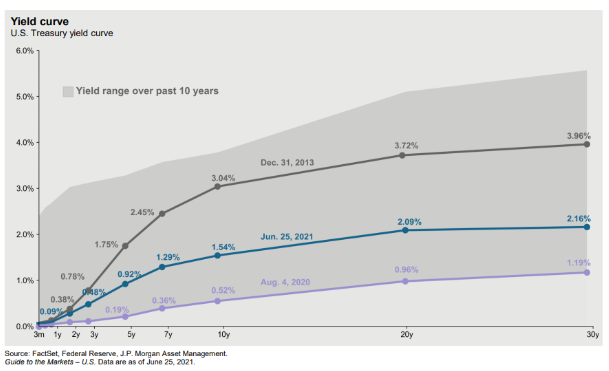
Chart source: JP Morgan
The third quarter should help shed light on how strongly corporate America is bouncing back from the pandemic shutdown, whether supply chain kinks can be ironed out, and whether the recent surge in prices is indeed transitory. Stories of Covid-variants notwithstanding, the US is back open for business and early indications are that people want to travel and spend again. In a few weeks we’ll hear about Q2 earnings and get a better feel for where things stand, but for now, we remain optimistic that 2021 will see strong GDP growth. One risk to near-term growth prospects is the ongoing semiconductor chip shortage, which is
rippling through numerous industries. For example, there is an acute shortage of new vehicles available on lots, and prices of used cars have soared, with the Mannheim US Used Vehicle Value Index up +26% YTD. GM and Ford have both indicated it may not be until Q4 before inventories normalize.
To conclude where we began, all of this is just plain weird! Textbooks and decades of experience haven’t prepared anyone for the strange combination of quantitative easing and fiscal largesse all in the context of a global pandemic, not to mention the ongoing social upheaval taking place before our eyes. Having said that, times have been challenging before, and as happened then, and likely now, is that patience, discipline and common sense will prevail. While Nottingham obsesses over every element of your portfolio, we do so in the hopes it offers you peace of mind. We’ve been thrown curveballs before, and we eventually figure them out. For now, time is on our side, as our horizon is long. Rest assured the Nottingham team will be spending its summer ensuring your hard-earned wealth remains thoughtfully invested and well diversified. As always, please reach out to us with any questions, comments or concerns.
Originally published by Nottingham
Nottingham Advisors, LLC (“Nottingham”) is an SEC registered investment adviser located in Amherst, New York. Registration does not imply a certain level of skill or training. Nottingham and its representatives are in compliance with the current registration and notice filing requirements imposed upon SEC registered investment advisers by those states in which Nottingham maintains clients. Nottingham may only transact business in those states in which it is registered, notice filed, or qualifies for an exemption or exclusion from registration or notice filing requirements. For information pertaining to the registration status of Nottingham, please contact Nottingham or refer to the Investment Advisor Public Disclosure Website (www.adviserinfo.sec.gov). Any subsequent, direct communication by Nottingham with a prospective client shall be conducted by a representative that is either registered or qualifies for an exemption or exclusion from registration in the state where the prospective client resides.
This newsletter is limited to the dissemination of general information pertaining to Nottingham’s investment advisory services. As such nothing herein should be construed as the provision of personalized investment advice. The information contained herein is based upon certain assumptions, theories and principles that do not completely or accurately reflect your specific circumstances. Information presented herein is subject to change without notice and should not be considered as a solicitation to buy or sell any security. Adhering to the assumptions, theories and principles serving the basis for the information contained herein should not be interpreted to provide a guarantee of future performance or a guarantee of achieving overall financial objectives. As investment returns, inflation, taxes and other economic conditions vary, your actual results may vary significantly. Furthermore, this newsletter contains certain forward-looking statements that indicate future possibilities. Due to known and unknown risks, other uncertainties and factors, actual results may differ materially from the expectations portrayed in such forward-looking statements. Readers are cautioned not to place undue reliance on forward-looking statements, which speak only as of their dates. As such, there is no guarantee that the views and opinions expressed in this article will come to pass. This newsletter should not be construed to limit or otherwise restrict Nottingham’s investment decisions.
This newsletter contains information derived from third party sources. Although we believe these third party sources to be reliable, we make no representations as to the accuracy or completeness of any information prepared by any unaffiliated third party incorporated herein, and take no responsibility therefore. Some portions of this newsletter include the use of charts or graphs. These are intended as visual aids only, and in no way should any client or prospective client interpret these visual aids as a method by which investment decisions should be made. We have provided performance results of certain market indices for illustrative purposes only as it is not possible to directly invest in an index. Indices are unmanaged, hypothetical vehicles that serve as market indicators and do not account for the deduction of management fees or transaction costs generally associated with investable products, which otherwise have the effect of reducing the performance of an actual investment portfolio. It should not be assumed that your account performance or the volatility of any securities held in your account will correspond directly to any benchmark index. A description of each index is available from us upon request.
Investing in the stock market involves gains and losses and may not be suitable for all investors. Past performance is no guarantee of future results.
For additional information about Nottingham, including fees and services, send for our Disclosure Brochure, Part 2A or Wrap Brochure, Part 2A Appendix 1 of our Form ADV using the contact information herein.
