
It’s been easy being a “capital preservation” investor for a long time. One simply had to invest in income-producing investments and ride the trend of falling long-term interest rates. Investors could get income AND total return with relatively low volatility. What could be better?
However, the trend in long-term interest rates might be changing and, if that happens, it implies the definition of “capital preservation” could significantly change. Finding a single investment that provides income, total return, and low volatility might become very difficult.
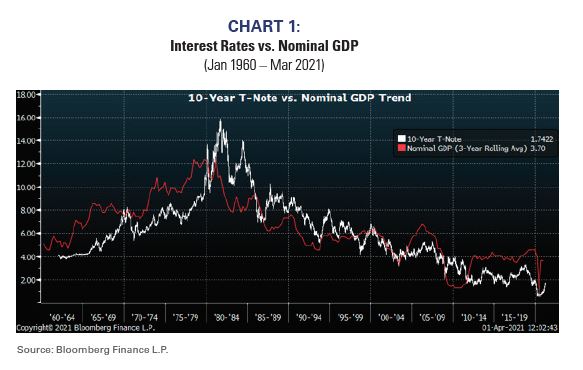
Rates follow nominal GDP
Long-term interest rates generally follow the trend growth of the nominal economy (i.e., real growth plus inflation), and the US’s 40-year economic deceleration has caused a 40-year secular decrease in long-term interest rates and a 40-year bond bull market.
Chart 1 shows how the secular slowdown in US growth has dragged down interest rates. The chart compares the 3-year trend of nominal GDP growth to the 10-year T-Note yield. Lower trend growth was probably the primary factor fueling the bond bull market.
Prior to the 1980’s inflation-fighting Federal Reserve, there was an upward trend in nominal growth and bond yields accordingly rose. Nominal GDP growth pulled rates up during the 1960s and 1970s, which may be relevant to today’s markets. It appears that the pandemic and not trend growth led to last year’s interest rate decline. Prior to the pandemic it appears nominal growth stopped decreasing and rates accordingly started to trade in a band. If nominal growth starts to accelerate, then it would follow longer-term interest rates should also increase.
Current median consensus forecasts for nominal GDP are about 8% for 2021 and 5% for 2022[1]. If those forecasts prove true, then long-term interest rates seem poised to increase and today’s capital preservation strategies, which rely heavily on fixed-income, might be inappropriate.
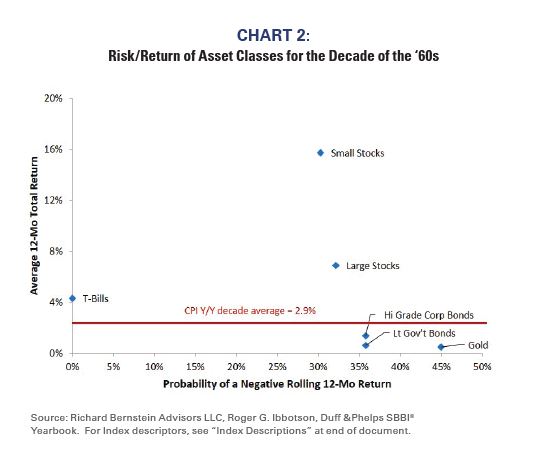
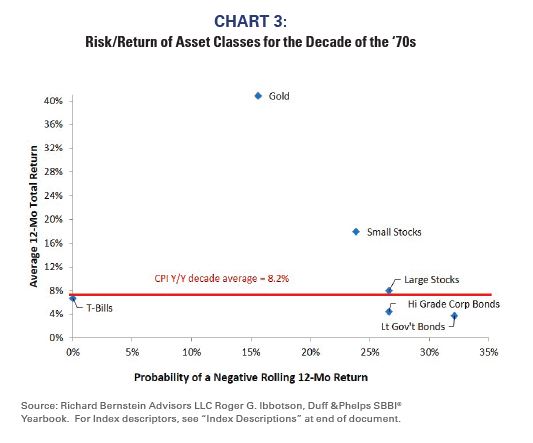
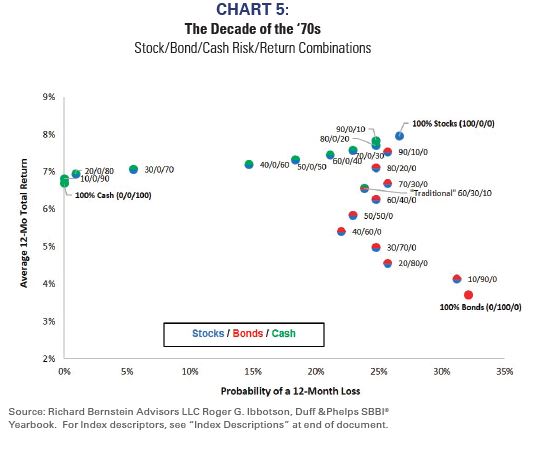
Capital Preservation in the 1960s and 1970s
If nominal growth could conceivably mimic the characteristics of the 1960s or 1970s, it may be worth understanding what asset classes actually provided a greater degree of capital preservation during those periods. Charts 2 and 3 show risk/return characteristics for various asset classes for the decade of the 1960s and the 1970s. Importantly, risk is defined in these charts as the probability of a loss among rolling 12-month periods rather than the typical standard deviation risk measure because capital preservation strategies are supposed to specifically limit downside risk.
There are several interesting points in these charts:
- Holding cash was beneficial and duration was penalized as interest rates rose. T-bills provided more downside protection than did corporate and government bonds and also outperformed bonds during both the 1960s and the 1970s. Cash was the only asset class to provide consistent downside protection during the two decades.
- Small stocks significantly outperformed bonds and provided slightly more downside protection. Although small stocks were hardly a riskless investment, they were indeed superior to bonds in both decades. Even large cap stocks had negative return less often than did bonds.
- Gold[2] did not perform well during the 1960s, but performed exceptionally well during the 1970s. Gold was the best performing asset class during the 1970s and bonds gave negative returns almost twice as often as did gold.
- If the definition of capital preservation is maintaining the purchasing power of the portfolio, then bonds were a terrible asset class during both the 1960s and the 1970s because the average return was less than the average inflation rate.
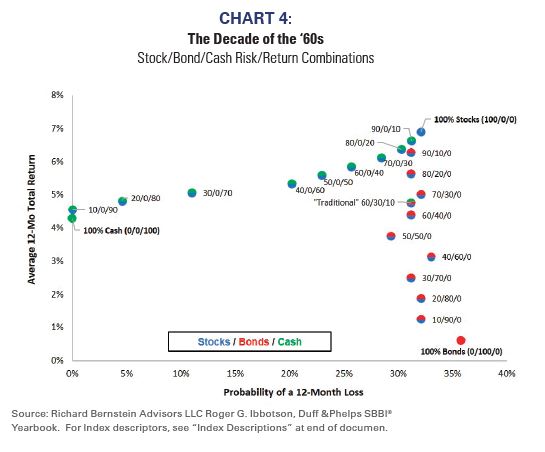
The return of cash?
Most investors today shun cash as an asset class because of historically low yields. However, cash could be a superior capital preservation investment to bonds should the economy and markets return to something resembling the 1960s or 1970s. Cash returns were not only less volatile than were bond returns during those two
decades, but cash actually had higher returns. Charts 4 and 5 show risk/return combinations for stocks, bonds, and cash. The blue/green dots depict combinations of stocks and cash, whereas the blue/red cots depict combinations of stocks and bonds.
Since the 1980s bonds have been considered the cornerstone of virtually every capital preservation portfolio. However, they were a terrible capital preservation investment during both the 1960s and the 1970s. No combination of stocks and bonds was superior to a combination of stocks and cash during those two decades.
The definition of “capital preservation” is changing
As we’ve written in many of our commentaries, the probability inflation could be higher and last longer than is current consensus seems to be rising, and institutional and individual investors’ portfolios seem ill prepared should that happen.
In particular, the definition of capital preservation might be changing. During the 1960s and 1970s bonds were not a capital preservation strategy. They provided negative returns more often than did other asset classes and lost purchasing power as inflation ramped up.
It seems unlikely investors will face 1970s-type inflation, but it does seem likely current capital preservation strategies could be inappropriate for the changing inflation, interest rate, and nominal growth backdrop.
Capital preservation has been very easy for a very long time as such strategies offered income, returns, AND low risk. However, history shows it hasn’t always been so easy, and it seems likely existing capital preservation strategies’ success could be tested during the next decade.
Investors may have to take a more nuanced approach to capital preservation strategies. If general disinflation does change to general inflation, capital preservation could focus on maintaining purchasing power. History suggests that might be achieved with combinations of high cash and high equity allocations, i.e., generally ignoring fixed-income as an asset class.
Because cash is today widely scorned as an investment and equities are often considered too volatile, convincing investors and oversight committees of the capital preservation benefits of such cash/stock barbell portfolios could be a sizeable challenge.
Originally published by Richard Bernstein Advisors, April 2021
- Median Real GDP Consensus forecast plus Median CPI Consensus forecast for CY 2021 and CY 2022. Source: Factset.
- The Bretton Woods system (1944) fixed the US dollar to gold @ $35 per ounce parity. In March 1968, a two-tiered pricing system was created with a freely floating private market and official transactions at the fixed parity. President Richard Nixon formally unpegged the dollar from gold in August 1971 and gold has been free traded since then according to the World Gold Council. https://www.gold.org/about-gold/history-of-gold/bretton-woods-system.
