
By John Eckstein, Astor Investment Management
One of the problems in this business is picking the few relevant pieces of information out of the endless stream of financial news, opinion and speculation. Like a prospectors looking for a slightly shinier flake of stone among the silt in our pans we occasionally pick out promising pieces we think have not gotten enough love. Janet Yellen’s speech last Friday was covered, but I think it deserves more attention.
The Chair made several points but only the prospects for rates this year got much press. The speech gave a clear (for a central banker) explanation of how the fed judges its performance over the last two years and where it sees the economy today and you should probably read it for yourself. Perhaps most importantly, the speech gives an answer to “Why should we believe you this time? You said you were going to hike in 2015 and 2016.” Yellen specifies what has changed in the economy since they hiked less than expected over the last few years
Yellen reviewed the monetary policy over the 2014-2016 period with the benefit of hindsight. The turning point for the fed came in 2014 when it judged that the economy was on a self-sustaining course. This, of course, lead to the gradual end of new securities purchases under QE (“the Taper”) and was anticipated by the fed to lead to more rapid increases in the fed funds rate than actually transpired over 2015-16.
Why did the fed not raise rates as quickly as they had thought they would? Mainly because of surprise weakness overseas and the strength in the dollar. These combined to cut exports by about 2% of GDP over 2015 and the new, lower level of exports has been sustained since. Additionally, the decline in energy prices leading to lower capital expenditure. The rise in the dollar and fall in energy prices also slowed inflation, giving the FOMC another reason to delay.
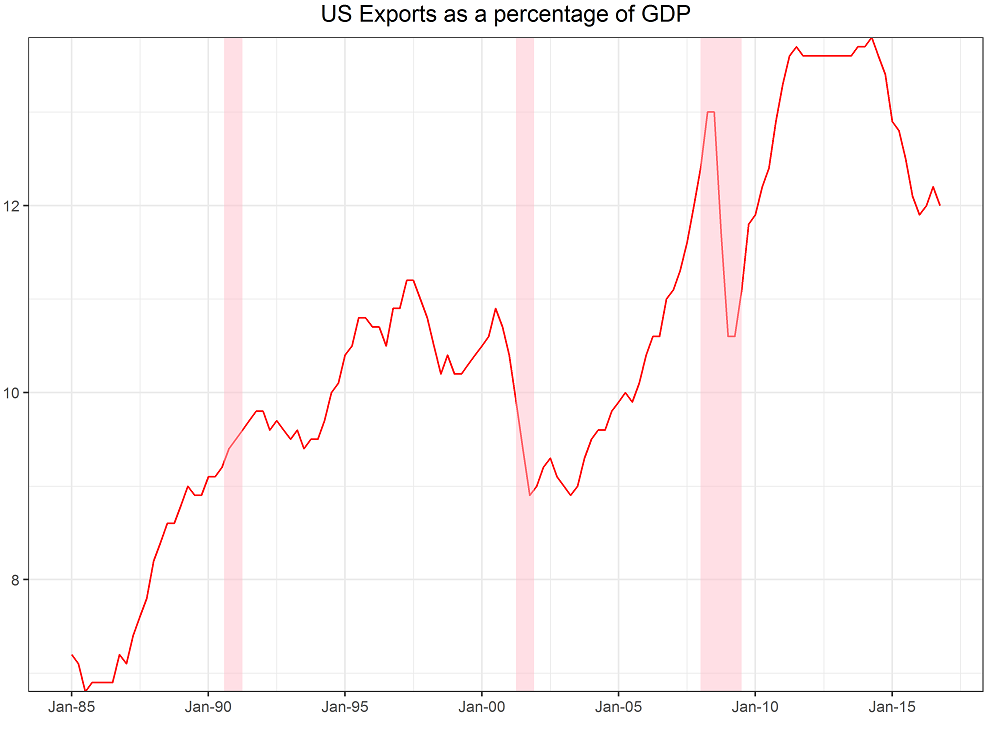
Source: Bureau of economic analysis
I have my own FOMC scorecard I like to use which graphs the Fed against its dual mandate of full employment and price stability. This chart emphasizes the good job they have done since the global financial crisis to set rates such that the labor market has made consistent progress toward full employment (the pink area in the chart) but maintaining price stability. In fact, the Fed has been below its inflation goal of about 2% over that period (the blue area in the chart). Based on this chart there was no compelling reason for the Fed to risk aggressive hikes over the last few years.
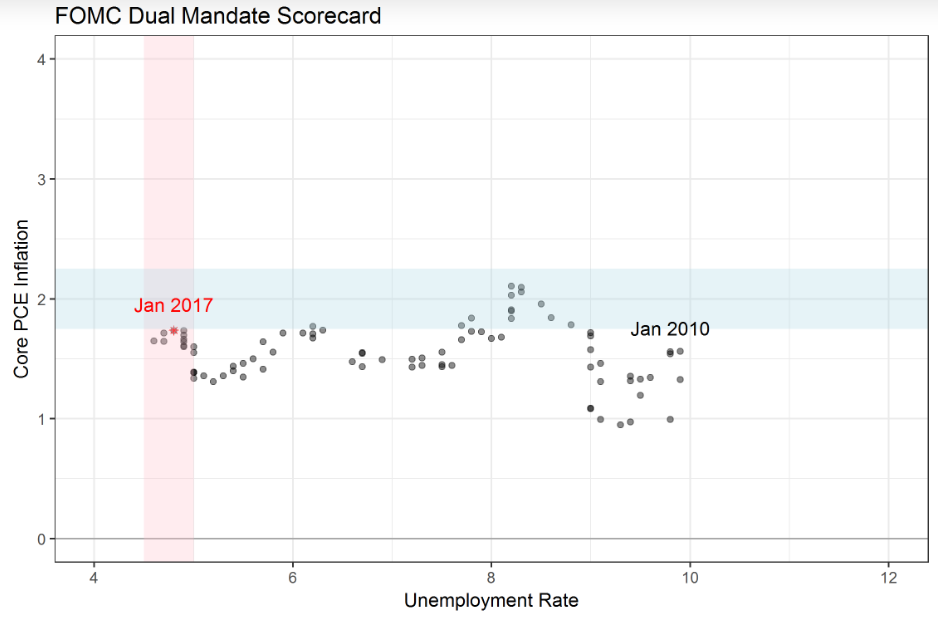
Source: Bloomberg, BEA, bureau of labor statistics
