It is no secret that active management has been increasingly critiqued in recent years, and asset flows are following suit as investors move to passive products.
One of the large recipients of these flows is index-based, quasi-active, smart beta and factor strategies that deliver returns of active managers, but at a fraction of the cost.
Historically, many of these factors have outperformed in nearly all environments – an impressive track record, but one that may be challenged as more assets move into the space.
However, we’ve written extensively on a number of clues as to what factors outperform and when, and what investors can do to give themselves the best chance to outperform going forward. Is there a connection between outperformance of factor investing and active management? Are correlations the answer to both?
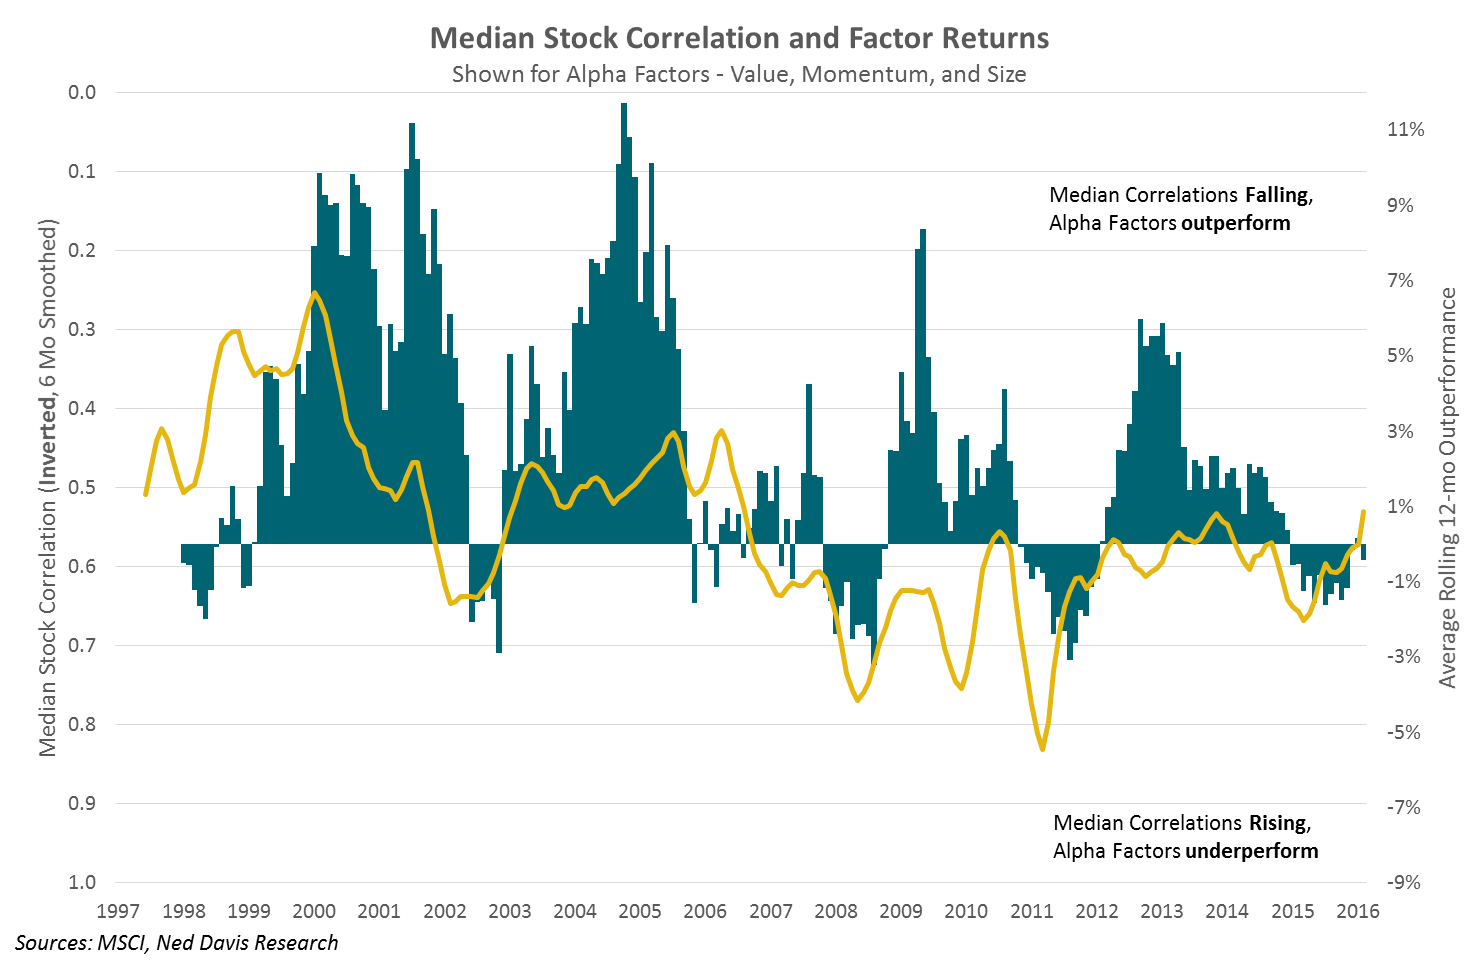
Looking over the past 15 years of factor returns for value, momentum, and size, we see a pretty consistent picture of outperformance, and in some cases quite sizeable outperformance. We’ll call these “alpha factors” as their general design is to outperform indices overtime, typically as stocks rise.
The chart below illustrates this outperformance relative to the parent MSCI USA Index. Overlaid on top is the median intra-stock correlation in the S&P 500 Index, inverted. So as correlations between stocks fall, the security selection that the alpha factors provide leads to outperformance, and vice versa.
© Copyright 2017 Ned David Research, Inc. Further distribution prohibited without prior permission. All Rights Reserved. See NDR Disclaimer at www.ndr.com/copyright.html. For data vendor disclaimers refer to www.ndr.com/vendorinfo/ *12-Month rolling average excess returns (vs MSCI USA) for MSCI USA Enhanced Value, MSCI USA Momentum, and MSCI USA Size Tilt indexes are shown against the 6-month average of median S&P 500 1-day correlations over the past trading quarter.
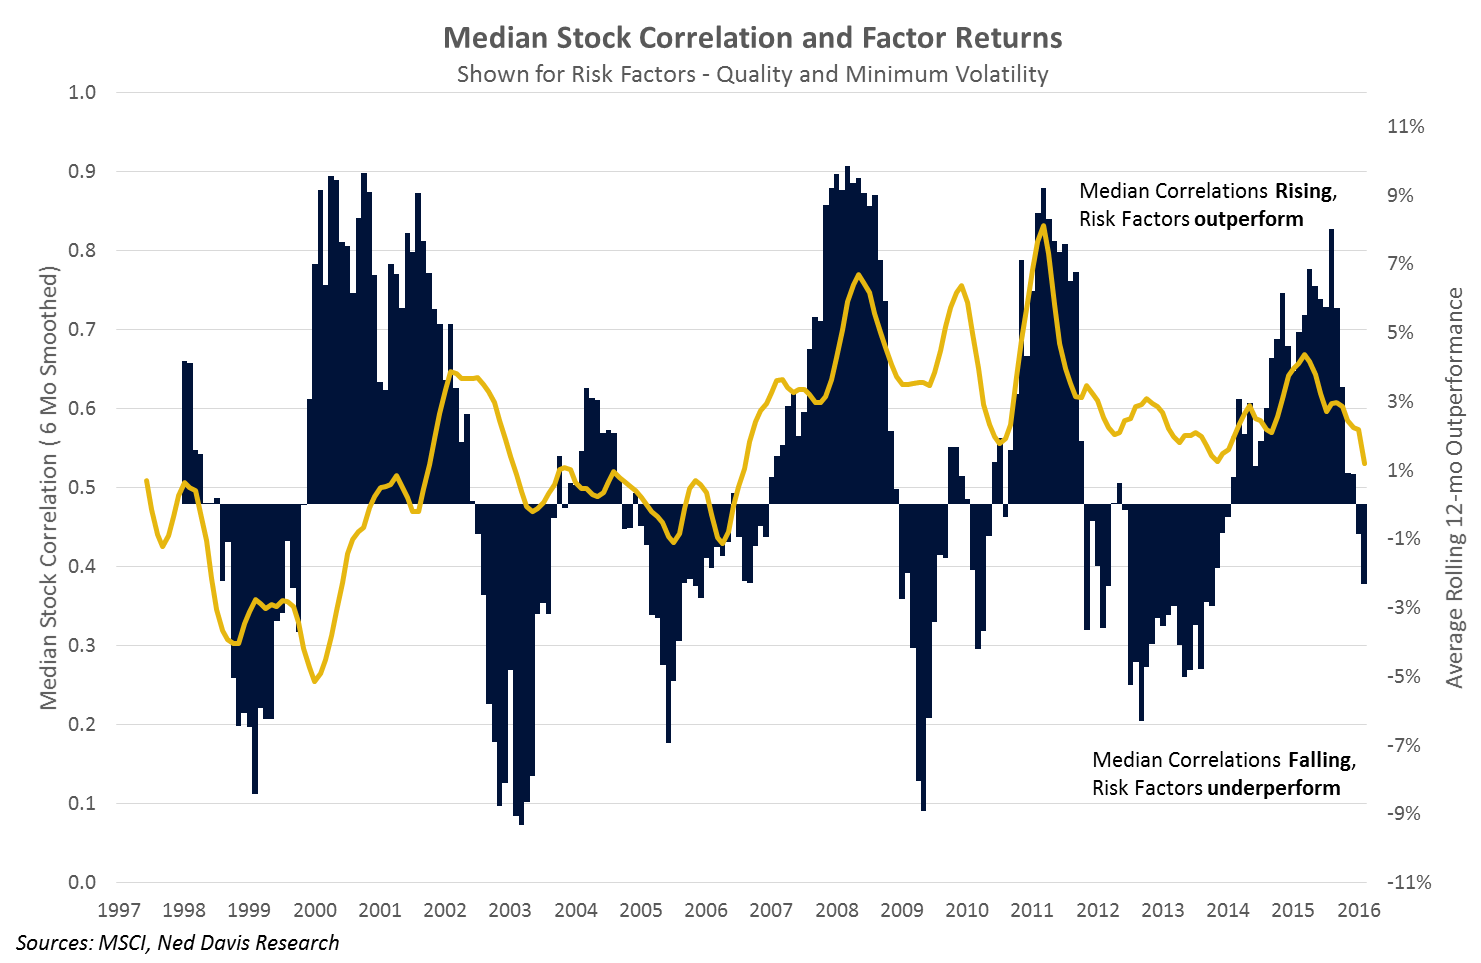
On the flip side, let’s look at quality and minimum volatility, factors we’ll call “risk factors” for their focus on managing risk and typical outperformance to the downside. The median stock correlation is no longer inverted on this chart, as rising correlations signify outperformance for these factors. Intuitively it makes sense, in periods of market stress correlations “go to 1” and money flows into the seeming safety of the holdings in these factors.
© Copyright 2017 Ned David Research, Inc. Further distribution prohibited without prior permission. All Rights Reserved. See NDR Disclaimer at www.ndr.com/copyright.html. For data vendor disclaimers refer to www.ndr.com/vendorinfo/ *12-Month rolling average excess returns (vs MSCI USA) for MSCI USA Quality and MSCI USA Minimum Volatility indexes are shown against the 6-month average of median S&P 500 1-day correlations over the past trading quarter.
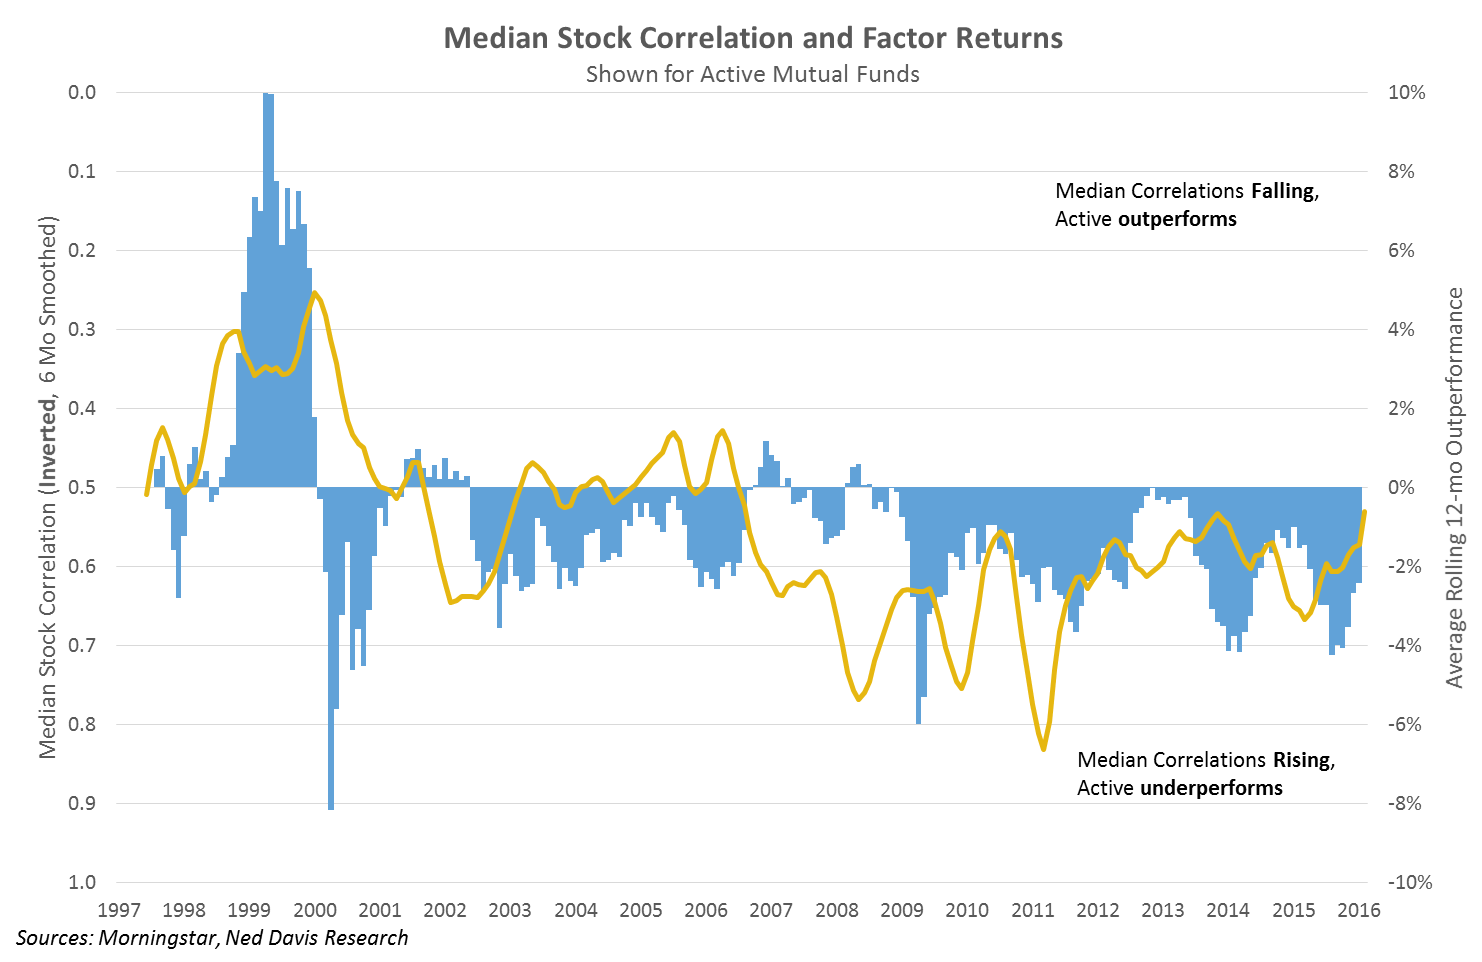
Now, the elephant in the room. What about active management? Historically, active management has had a better opportunity to outperform when correlations and multi-asset dispersion is low. Again, intuitively it makes sense, as diverging returns between individual stocks and asset classes lends more opportunity for better security selection. The (inverse) correlation is there, but what is troubling is the length of time since any meaningful outperformance by active management as a group. Now, we shouldn’t expect all active managers to outperform consistently overtime, that wouldn’t make logical sense. However, looking at the consistency and extent of recent outperformance it’s no surprise to see the outflows that we’ve witnessed.
© Copyright 2017 Ned David Research, Inc. Further distribution prohibited without prior permission. All Rights Reserved. See NDR Disclaimer at www.ndr.com/copyright.html. For data vendor disclaimers refer to www.ndr.com/vendorinfo/ *12-Month rolling average returns for the excess return of Morningstar style box fund categories vs Morningstar Style Box Indices are shown against the 6-month average of median S&P 500 1-day correlations over the past trading quarter.
What is to blame for years of active underperformance? Fees are the typical scapegoat. Low interest rates, low volatility, and low dispersion have had an impact as well. Expense ratios for active funds have come down some over time, but not nearly as much as most would expect to counteract the move to passive products.
The good news for active management (and alpha factors for that matter) is that intra-stock correlations have plummeted to the lowest level in over 10 years. The potential for rising interest rates and diverging global monetary and fiscal policies should lend to lower correlations.
However, until active managers embrace the efficiency of the ETF structure to help reduce their largest reason for underperforming (costs), some of these trends may unfortunately continue. Too much transparency will likely continue to be the main hindrance, but large active equity managers are starting to look past that and become less worried about the front-running worries that have kept many stock pickers away from the ETF structure. Index arbitrage and front-running have been noted to lower index returns, but even with lower returns active managers still can’t beat the indexes! Factor based and smart beta investing will continue to generate alpha, benefiting from the same potential changes that will impact active managers, but with a large head start in the form of lower costs.
Grant Engelbart is a Portfolio Manager at CLS Investments, a participant in the ETF Strategist Channel.
Disclosure Information
This information is prepared for general information only. Information contained herein is derived from sources we believe to be reliable, however, we do not represent that this information is complete or accurate and it should not be relied upon as such. All opinions expressed herein are subject to change without notice. The graphs and charts contained in this work are for informational purposes only. No graph or chart should be regarded as a guide to investing. 2191-CLS-1/31/2017