By Gary Stringer, Kim Escue and Chad Keller, Stringer Asset Management
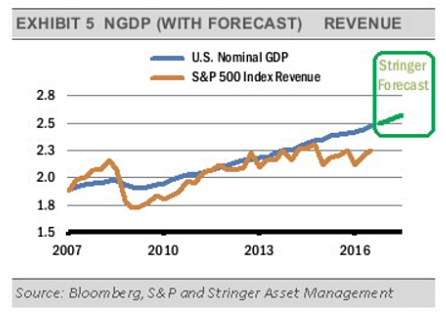
We have increased our forecast for U.S. economic growth in 2017 as expansionary fiscal policy will likely fuel inflationary pressures, thus adding to our expectations of increased productivity and consumer spending.
When creating our market expectations, we focus on nominal GDP (NGDP), which is real GDP plus inflation. We care more about NGDP because revenue and earnings growth include inflation.
In generating long-term forecasts for real GDP (not including inflation), we think about the growth rate of the labor force and labor force productivity. Productivity is more difficult to forecast because it is based largely on new technologies and innovation. The Bureau of Labor Statistics forecasts annual labor force growth of roughly 0.5% and approximately 1.8% for productivity growth, for a 2.2% real GDP forecast.
These expectations have increased in recent months, pushing up our expectations for NGDP from 3.7% to 4.2%, which is an improvement over recent periods.
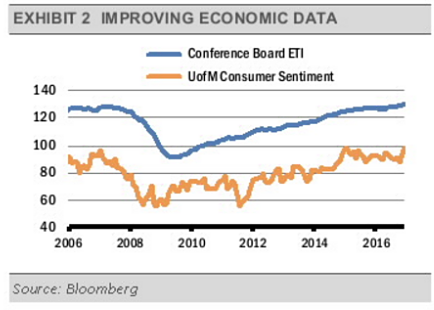
Fundamentally, we are seeing signs of domestic economic growth, including improvements in consumer confidence and labor market trend indicators, such as The Conference Board’s Employment Trends Index (ETI). These indicators measure different areas of the economy and suggest a virtuous cycle where increasing business trends are leading to more jobs and increasing consumer confidence (exhibit 2).
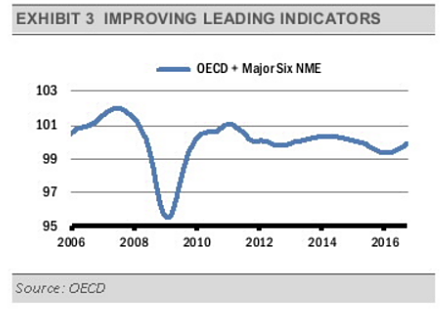
The recent uptick in LEIs is led by ongoing stability in the U.S., a firming of China’s economic growth, as well as an end to the recession in Russia and recent depression in Brazil. Adding support to this theme, we think that accelerating U.S. growth will increase demand for imports, pulling economic growth in other countries higher.
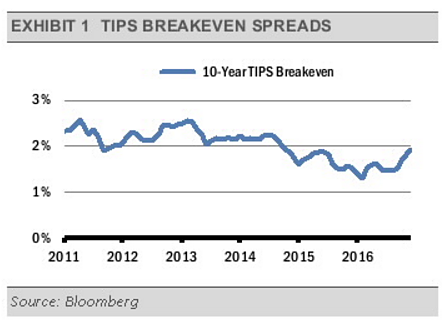
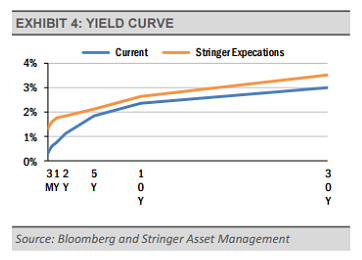
Given that the economy is close to full employment, improvements in labor market conditions will likely lead to higher wages, increased inflation expectations, and more Fed policy tightening. We think this will lead to short-term interest rates rising and the U.S. dollar strengthening as foreign central banks remain more accommodative. We think short-term rates may rise 1.0% in 2017, and more in 2018.
INVESTMENT IMPLICATIONS
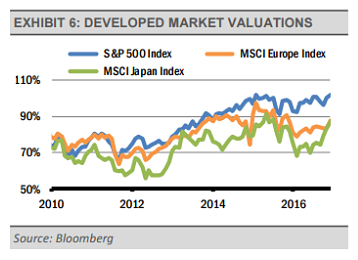
While we are finding pockets of opportunity domestically, we think that U.S. equities are fairly valued. Internationally, emerging markets appear to be fully valued at this point, though we are seeing more interesting equity valuations in Europe and Japan.
We think that increasing U.S. NGDP will support increased corporate revenues (exhibit 5). Increased revenue growth can propel earnings higher. Note that we expected all of this to occur even without the new Presidential administration’s announced policies regarding corporate tax reform. Additional tailwinds from lower tax rates can propel earnings even higher.
Still, much of this good news has likely been priced-in to U.S. equities as they have rallied since the election.
The U.S. technology sector is one area that has not rallied as strongly, and we are still finding investment opportunities there. Additionally, we are seeing more attractive investment opportunities overseas, where low valuations (exhibit 6) combined with various forms of stimulus measures create attractive potential investments. For example, we view monetary stimulus from both the European Central Bank and the Bank of Japan as a positive.
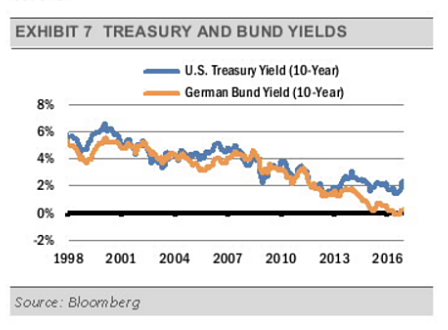
We think that in today’s global economy, where money flows freely across international borders, the natural level of interest rates is also influenced by global economic conditions, such as global economic growth, inflation, employment trends, and credit spreads.
For example, if the German Bund, which is a similar credit quality as the U.S. Treasury Bond, yields 1.0%, the U.S. Treasury Bond of a similar maturity should yield a similar rate, accounting for other costs, such as currency exchanges. If the Treasury moves sufficiently higher relative to the Bund, global investors will sell Bunds and buy Treasuries. Currently, the difference in yield between the 10-year Treasury and the Bund is approximately 5 times its historical average (exhibit 7).
With long-term yields at higher levels, we think there is attractive value in areas that got hit the hardest when bonds sold off.
Our more optimistic outlook is also reflected in our allocations to alternative, or non-traditional, investments. We think convertible bonds can provide equity-like upside with lower volatility.
Looking at more defensive holdings, we think that the Fed’s increases in short-term interest rates will favor floating-rate bonds. Unlike traditional bonds, the coupon rate on floating-rate instruments can adjust higher with interest rates, which keeps the coupon around current market levels. Therefore, their value does not have to fall to the same degree as a fixed-rate instrument to keep the yield in-line with the market.
Overall, we think these areas will allow for appreciation, while still performing well as short-term interest rates rise.
Going forward, we expect equity and bond market volatility to continue as fiscal stimulus in the U.S. collides with Fed tightening. In summary, with an eye towards risk management, we are positioned to benefit from an accelerating global economy, rising short-term interest rates, and a strengthening U.S. dollar.
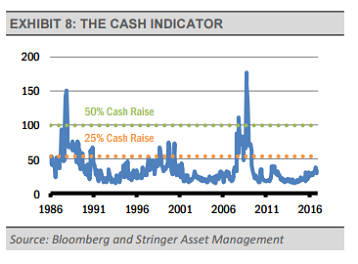
THE CASH INDICATOR
The level of the Cash Indicator (CI) has declined in recent weeks as credit spreads have tightened, confirming the recent confidence displayed in the equity markets.
Though the CI elevated throughout most of the year due to changing market and regulatory environments, the CI has consistently suggested that investors should remain invested according to their long-term plans.
Even in the depths of the January and February market volatility, the CI clearly suggested that 2016 was not going to be another 2008.
This tool has again proved valuable throughout these volatile markets.
This article was written by Gary Stringer, CIO, Kim Escue, Senior Portfolio Manager, and Chad Keller, COO and CCO at Stringer Asset Management, a participant in the ETF Strategist Channel.
DISCLOSURES
Any forecasts, figures, opinions or investment techniques and strategies explained are Stringer Asset Management LLC’s as of the date of publication. They are considered to be accurate at the time of writing, but no warranty of accuracy is given and no liability in respect to error or omission is accepted. They are subject to change without reference or notification. The views contained herein are not be taken as an advice or a recommendation to buy or sell any investment and the material should not be relied upon as containing sufficient information to support an investment decision. It should be noted that the value of investments and the income from them may fluctuate in accordance with market conditions and taxation agreements and investors may not get back the full amount invested. Past performance and yield may not be a reliable guide to future performance. Current performance may be higher or lower than the performance quoted.
Data is provided by various sources and prepared by Stringer Asset Management LLC and has not been verified or audited by an independent accountant.