
By Larry Whistler, Nottingham Advisors President/Chief Investment Officer
2016 was a remarkable year that will be remembered for many things.
As we suggested in our last letter, could the Cubs possibly win the World Series? YES!
Could the Federal Reserve actually agree to raise interest rates in December? YES!
And, most far-fetched of all, could Donald Trump actually win the contest for the Presidency of the United States? Um, yes.
And so, we had the year 2016 pre-November 8th, and the year 2016 (and beyond), post-election day. And what very different worlds they were, and are likely to be going forward.
As we roll into 2017, very little of the “new order” is known, much less certain. President-elect Trump has seemingly surrounded himself with well-known, successful business-types, a la Reagan, but as for his actual agenda, much remains to be seen.
As terrified as markets were of a Trump presidency pre-election day, there’s a positive giddiness in the stock market these days.
A Brief Review of 2016 Last year was frustrating for investors on a lot of levels, but for valuation-sensitive asset allocators such as ourselves, it was positively maddening.
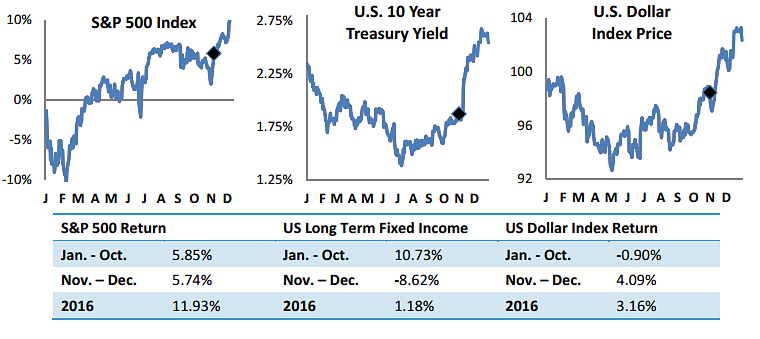
After a swift decline to open the year, equities rallied strongly into the summer and early fall, before pulling back some in the face of a likely Clinton election win.
By November 8th, as the charts above show, U.S. equities hadn’t Energy 13.84% Financials 16.59% Utilities 13.30% Telecommunications 12.74% Info Tech 10.83% Energy 8.69% Con. Disc 0.79% Healthcare 0.93% Real Estate ‐1.30% Utilities ‐0.74% Healthcare ‐5.25% Con. Staples ‐1.69% Losers Losers S&P 500 Sector Returns Jan. ‐ Nov. (Pre‐Election) Nov. ‐ Dec. (Post‐Election) Winners Winners done much while international developed markets did even less. And bonds rallied! The U.S. 10-year Treasury note yield reached an all-time low of 1.35% in mid-July, while international sovereign yields from the likes of Germany, Japan and Switzerland dipped into negative territory (-0.19%, -0.30%, -0.70% respectively).
After being swiftly and severely penalized for implementing risk measures in February, Nottingham managed to eke out reasonable returns in a very difficult environment. Much to our chagrin, we didn’t own enough of the truly risky (emerging markets) or the truly expensive (U.S. small cap) to beat our benchmarks. Nor did we (much to some of our client’s chagrin) own the Dow Jones Index. Then again, I’m not exactly sure who does own the Dow Jones Index! It ended 2016 up 16.4%, largely thanks to a few select stocks in this arcane price weighted index methodology.
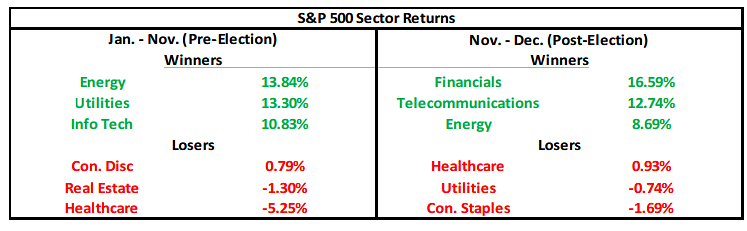
Looking at 2016 through the lens of “pre-election” vs. “post-election”, we find unique winners in each, with only energy remaining constant. Utilities, for example, were one of the best sectors through mid-year, up 23%. They proceeded to lose -7% over the balance of the year and were one of the worst sectors post-election.
Financials were up only about 1% through early October, before catching a huge election-related bid in November to close up 23%! Such was the seachange in investor psychology that has occurred since the election.
As for bonds, the tale of two trades was even more pronounced. Through the first half of 2016, culminating in the shock Brexit vote, bond yields were on a swift trajectory lower.
