
Following the outcome of the U.S. presidential and congressional elections, the market narrative switched to a focus on the new regime’s pro-growth agenda and concerns around the implied costs of increasing fiscal spending. Consequently, risky assets outperformed risk-off assets.
For example, equities and commodities outperformed sovereigns, and small capitalization equities outperformed large capitalization equities. Moreover, fixed income sovereigns experienced the worst monthly returns since September 2008.
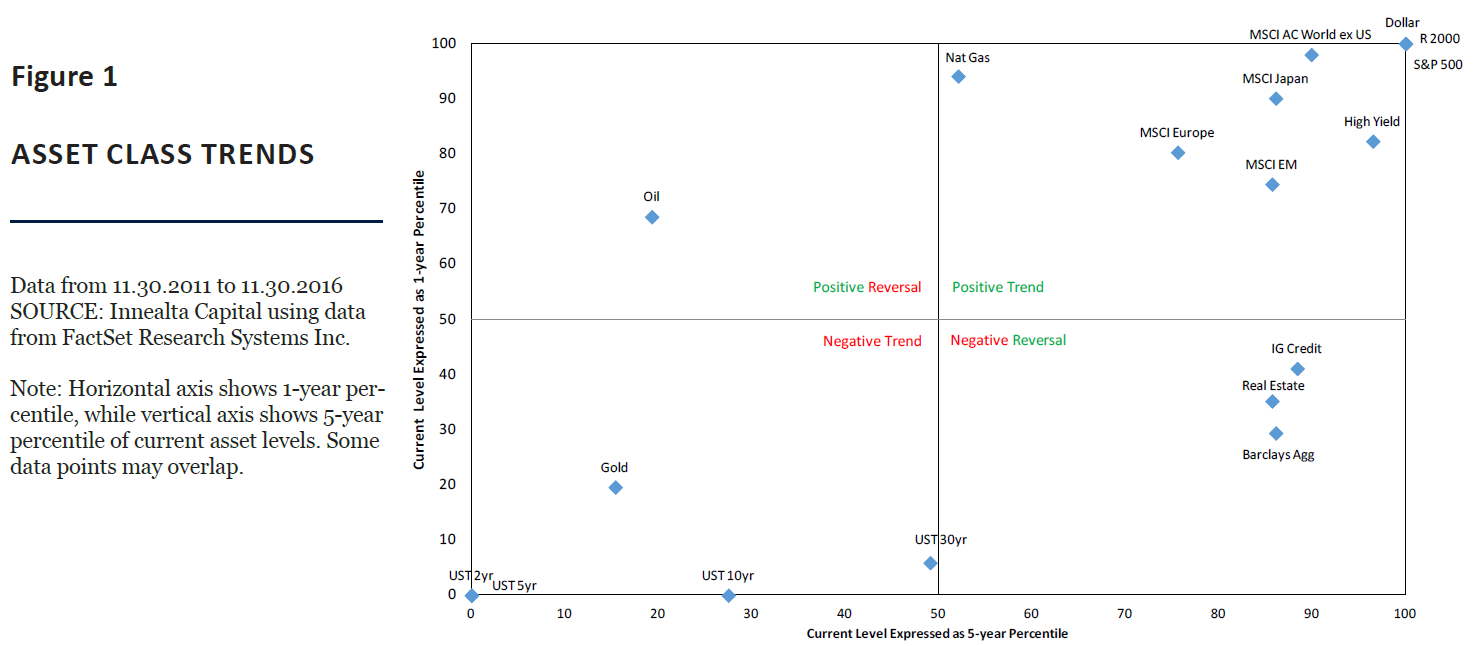
Figure 1 shows the snapshot of the current trends and reversal across global assets by plotting the current level of various asset classes using a short time frame, 1 year, and a longer time frame, 5 years. The data shows that risky assets remain on a positive trend, fixed income sovereigns remain on a negative trend, and fixed income investment grade credit is experiencing a negative reversal.
Overall, global asset performance during November continued to show high levels of return dispersion, which has become a recurring theme for 2016.
SURPRISING ELECTION OUTCOMES
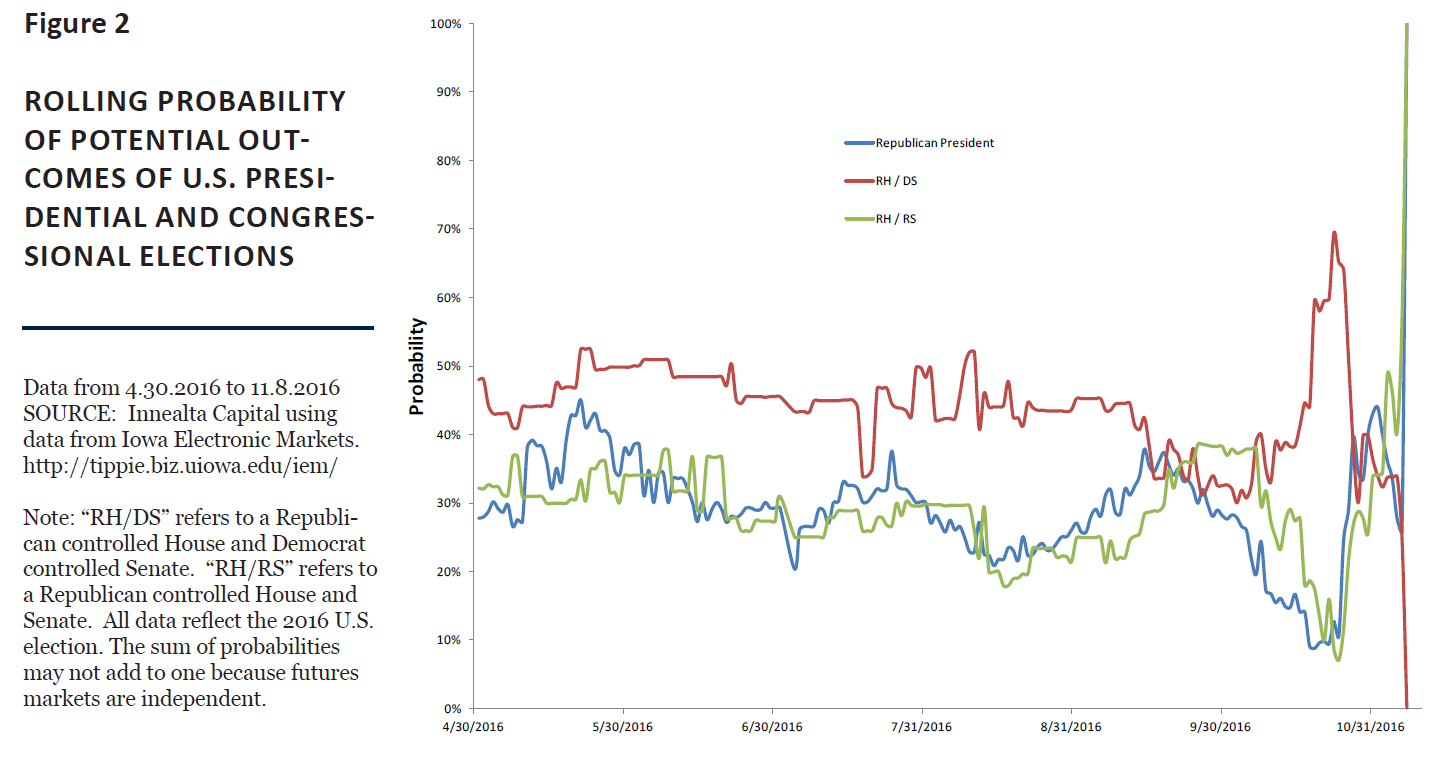
In the days prior to the election, the Iowa Electronic Markets futures implied a 90% probability of a Democrat Presidential win and a 65% probability of Democrat Senate win with a Republican House of Representatives. Financial and political analysts were in agreement with that shown in the futures and betting markets.
Figure 2 shows the evolution of the various election outcomes over time. Two weeks prior to the election, most political analysts assumed a Democratic president and a split House/Senate. This outcome would have implied a continued gridlock of legislative bills and reforms. Ultimately, Republicans shocked markets by gaining control of the executive branch and the totality of the legislative branch of the U.S. government. With the abrupt change in fiscal policy expectations following the election, investors adjusted their view and markets rallied.
BOND BEARS
Many of our readers may still be wondering: why did the bond market sell off immediately following the outcome of the U.S. presidential election? The most plausible thesis is that the election outcome would reduce Congressional gridlock and President-elect Trump’s fiscal policy will require significant amount of additional funding. The increase in funding and potential increase in debt-to-GDP forced fixed income investors to demand a higher yield for lending to the U.S. government. An alternative thesis is that the market began to accept the likelihood of sustainable, increased growth and needed to adjust its expectations relative to the FED.
Prior to the U.S. election, macroeconomic growth data had already been improving. U.S. corporate earnings, GDP, ISM Purchasing Managers’ Index, and consumer confidence were increasing and beating expectations. If the FED has more information about the overall state of the US economy, given its role, then the fixed income markets needed to readjust to FED expectations. Figure 3 shows the FOMC dot plot overlaid with the overnight index swaps (“OIS”) as of 09/21/16 and 11/30/16. Had fixed income market expectation matched the FED’s expectations, then the ‘OIS – As of Meeting Date’ line would overlap the ‘FOMC Dots Median’ line. However, since the last FED meeting, swaps terminating in 2019 moved from 82 bps to 157 bps. Although fixed income markets experienced a significant move in November, they still disagree with the FED on the terminal level of interest rates for 2017, 2018, and 2019.
