
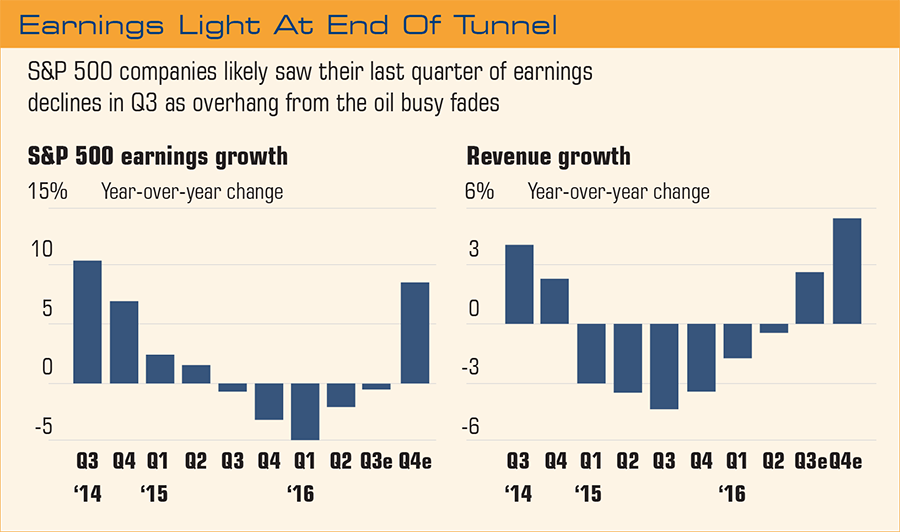
Projections on earnings and revenue for the fourth quarter are very healthy at the moment as you can see. These estimates tend to be lowered as the quarter progresses but still this is fuel that the bull market needs to advance.
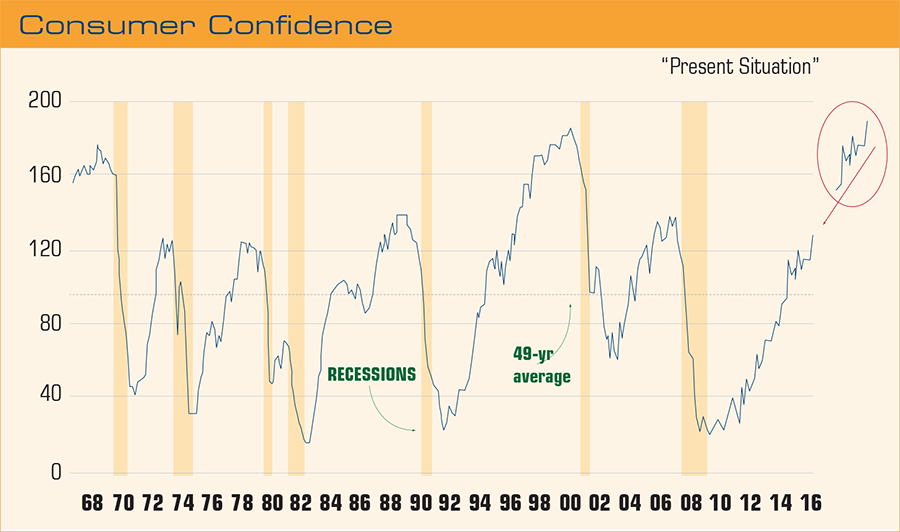
The chart of Consumer Confidence shows a large jump, and it has reached a nine-year high according to James Stack of InvesTech Research. This is a very encouraging sign as 70% of our economy depends on consumer spending.
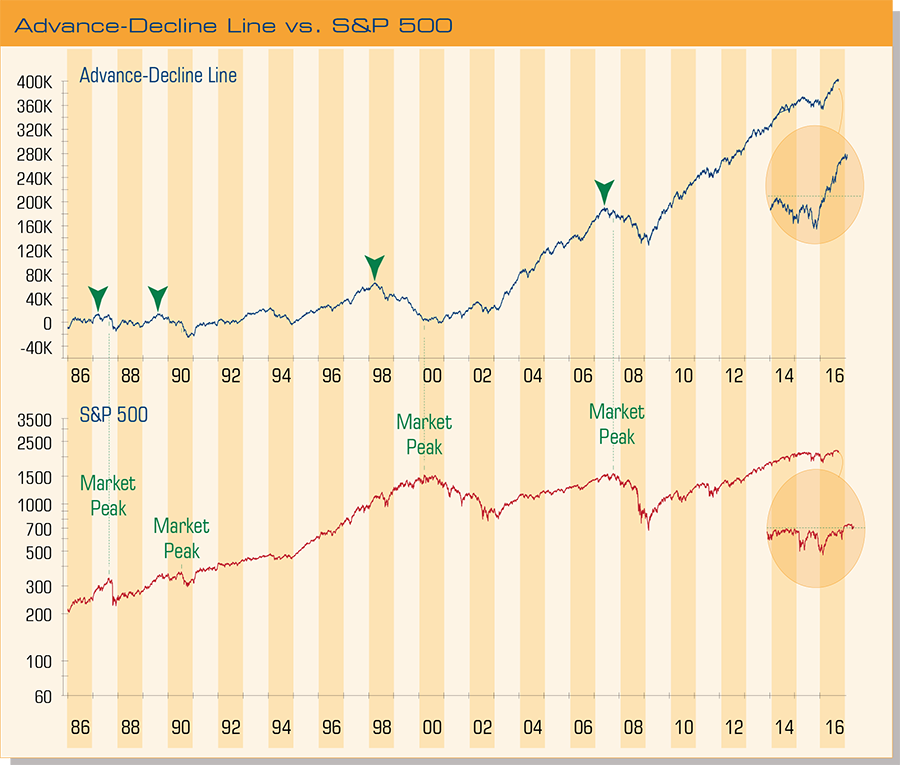
Technical evidence to support a continuing Bull market is also an important factor in determining where we are in the overall picture. We believe one very good indicator of future market performance is the advance-decline line. This simply compares stocks that are moving higher with those moving lower. It is almost always a harbinger of things to come, whether up or down, and it leads the way as you can see from the arrows.
The following quote from James Stack who, along with Ned Davis, is my favorite market technician sums up the technical picture: “The combination of strong breadth, lack of divergences, and a lack of downside leadership paints a bullish technical picture for the months ahead.”
Summary
I am very pleased to say that this firm has been ranked as one of the 300 Top Registered Investment Advisors in the United States by the Financial Times*.
The third quarter of this year showed a little more spunk than the first two as the S&P 500 returned 3.85% and the Dow Jones returned 2.78% including dividends. The S&P 500 is up 7.85% for the year to date which puts it right in the average gain target or 10.4% for a presidential election year.
Ned Davis Research has published a report detailing twelve reasons why the current secular Bull market should continue. Some, but not all, are discussed in this report.
Our standout performer for this quarter, and year to date, is our Fixed Income Total Return Strategy. As you may know, this strategy moves between high yield bonds, high quality bonds, and T-bills. This strategy was in T-bills earlier in the year and moved to high yield on February 29th. The strategy gained 4.35% (3.58% net of all possible fees) for the quarter and is ahead 16.39% (13.84 net) for the year to date.
High yield bonds have rallied for eight straight months against a supportive technical backdrop, an accommodative Fed, and continued moderate economic growth. Credit spreads (yield on high yield bonds – 10-year Treasury yield) are a contributing factor to the success of the high yield space. The current credit spread is 458 basis points which indicates to us that high yield bonds are not overly expensive as an asset class given historical precedent. The long term mean spread is 500 bps. Credit spreads peaked on February 11th at 840 bps and have been moving lower as high yield bond prices are moving higher.
Disclosure Information
*The ranking shown above is not indicative of the adviser’s future performance and many not be representative of any one client’s experience because the ranking reflect an average of all, or a sample of all, the experiences of the adviser’s clients.This is the third annual FT 300 list, produced independently by the Financial Times Ltd. in collaboration with Ignites Research, a subsidiary of the FT that provides business intelligence on the investment management industry. The “average” FT 300 firm has been in existence for 22 years and manages $2.6 billion in assets. The 300 top RIAs hail from 34 states and Washington, D.C. More than 1,500 pre-screened RIA firms were invited to apply for consideration, based on their assets under management (AUM). Applicants that applied were then graded on six criteria: AUM; AUM growth rate; years in existence; advanced industry credentials of the firm’s advisors; online accessibility; and compliance records. Neither the RIA firms nor their employees pay a fee to The Financial Times in exchange for inclusion in the FT 300.The FT 300 is one in series of rankings of top advisers the FT produces in partnership with Ignites Research, including the FT 401 (DC retirement plan advisers) and the FT 400 (financial advisers from traditional broker-dealer firms).
Past performance is not indicative of future results. This material is not financial advice or an offer to sell any product. Not every client’s account will have these exact characteristics. The actual characteristics with respect to any particular client account will vary based on a number of factors including but not limited to: (i) the size of the account; (ii) investment restrictions applicable to the account, if any; and (iii) market exigencies at the time of investment.
The S&P 500 measures the performance of the 500 leading companies in leading industries of the U.S. economy, capturing 75% of U.S. equities.
The opinions expressed are those of the Clark Capital Management Group Investment Team. The opinions referenced are as of the date of publication and are subject to change due to changes in the market or economic conditions and may not necessarily come to pass. There is no guarantee of the future performance of any Clark Capital investment portfolio. Material presented has been derived from sources considered to be reliable, but the accuracy and completeness cannot be guaranteed. Nothing herein should be construed as a solicitation, recommendation or an offer to buy, sell or hold any securities, other investments or to adopt any investment strategy or strategies. For educational use only. This information is not intended to serve as investment advice. This material is not intended to be relied upon as a forecast or research. The investment or strategy discussed may not be suitable for all investors. Investors must make their own decisions based on their specific investment objectives and financial circumstances.
Clark Capital Management Group, Inc. reserves the right to modify its current investment strategies and techniques based on changing market dynamics or client needs. The information provided in this report should not be considered a recommendation to purchase or sell any particular security, sector or industry. There is no assurance that any securities, sectors or industries discussed herein will be included in or excluded from an account’s portfolio. Asset allocation will vary and the samples shown may not represent an account’s entire portfolio and in the aggregate may represent only a small percentage of an account’s portfolio holdings. It should not be assumed that any of the investment recommendations or decisions we make in the future will be profitable or will equal the investment performance of the securities discussed herein.
The relative strength measure is based on historical information and should not be considered a guaranteed prediction of market activity. It is one of many indicators that may be used to analyze market data for investing purposes. The relatives strength measure has certain limitations such as the calculation results being impacted by an extreme change in a security price.
Clark Capital Management Group, Inc. is an investment adviser registered with the U.S. Securities and Exchange Commission. Registration does not imply a certain level of skill or training. More information about Clark Capital’s advisory services can be found in its Form ADV which is available upon request. CCM-656
