
U.S. equity performance was mixed this month, with the Dow Jones Industrial Average, S&P 500, and Russell 3000 returning -0.41%, +0.16%, and +0.19% respectively.
Though equity performance could be considered being flat for the month, spikes in daily volatility were not absent as the CBOE volatility index, also known as the VIX, reaching 18.14 on 09/14/2016. This level constitutes the highest since the “Brexit” referendum in late June.
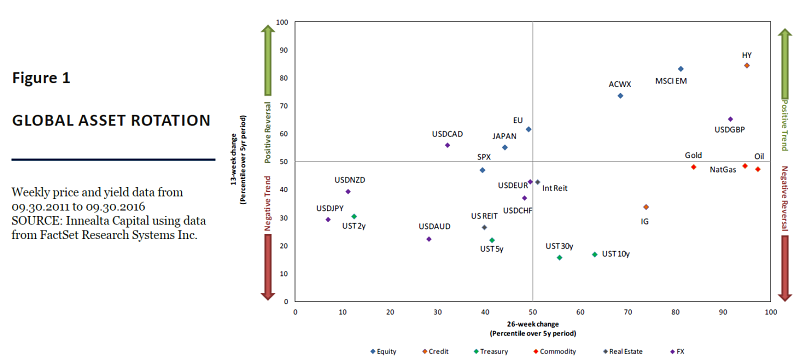
Performance dispersion in global markets remained elevated in September. Figure 1 shows the rolling 13-week and 26-week performance percentile rankings of each asset over the last 5-year period.
Assets in the top-right quadrant, for example, have performed well in the last 13- and 26-week periods, constituting a positive trend in the asset’s price.
Within our categorization, the top performers are MSCI Emerging Markets, High-yield fixed income, and MSCI All Country World ex. U.S. Short term performance of sovereign fixed income markets has been weak, and shorter maturity Treasury markets such as the UST 2yr and UST 5yr are in negative trends.
Finally, the foreign exchange market, particularly the British pound and Japanese Yen, continue to exhibit opposing trends relative to the dollar and have further contributed to FX return dispersion.
FOREIGN EXCHANGE FOCUS
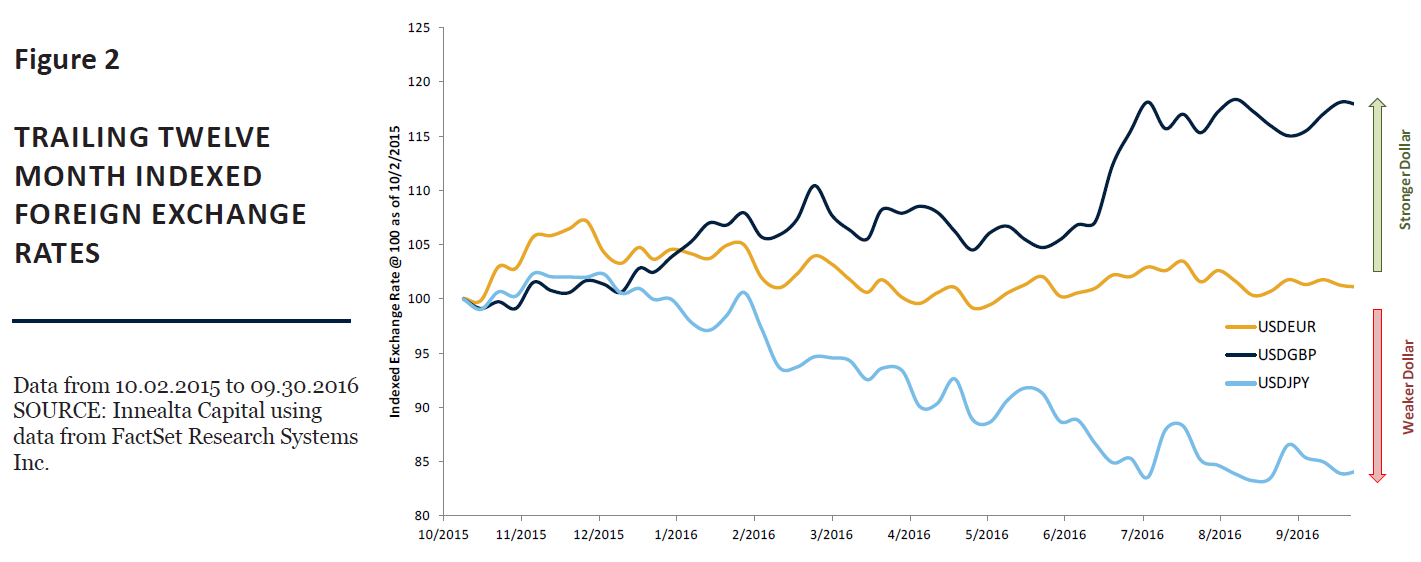
Currencies, relative to the dollar, have followed divergent paths over the last year. Particularly, the British Pound remains weak, the Japanese Yen remains strong, and the Euro remains within a tight trading range.
Figure 2 shows the change in FX rate between USD and GBP, USD and EUR, and USD and Yen respectively. The rates are indexed to 100 in order to show how these currencies have fluctuated over the last 12 months.
Uncertainty around the British exit from the European Union continues to weaken the British Pound. The Bank of
Japan, by not increasing the amount of monetary intervention, helped the Japanese Yen to continue strengthening relative to the dollar.
In addition, during September, both the FED and the European Central Bank (ECB) met market expectations by maintaining benchmark lending rates.
With no significant change in expectations, the exchange rate between dollars and euros has remained within a tight trading range. The ECB holds another meeting on 10/20/16 and the FED releases its September minutes on 10/12/16.
Unfortunately the market will wait until early November for additional monetary policy data when the Bank of Japan and the FED holding meetings on 11/01/16 and 11/02/16, respectively.
OIL FOCUS
On September 28th, 2016, news of a potential OPEC oil production freeze shifted market expectations of the commodity’s price.
The proposed production cut ranges from 200,000 to 700,000 barrels per day and requires agreement during OPEC’s 11/30/16 meeting.
Assuming the midpoint of 450,000 barrels per day, the cut represents a decrease of approximately 0.47% of world oil production. If the agreement occurs and demand remains flat, it will mark the first time since December 2013 where supply is less than demand.1
On the day of the news, oil and oil-sensitive markets rallied as WTI crude oil futures increased 5.3%, the S&P 500 energy sector increased 4.3%, and the U.S. High Yield credit market increased 0.67%.
Despite the recent optimism, a performance analysis of different time frames shows a different story. Figure 3 indexes the price of crude oil to 100 as of 12/31/2013 and, subsequently, as of 12/30/2015.
