
A relatively calm month, August saw mixed results from second quarter corporate revenue and earnings announcements. Market expectations of a Fed interest rate hike increased. Nevertheless, U.S. equity markets continued the bull market rally and closed the month less than 1% from all-time highs.
KEY TAKEAWAYS
• United States equity markets remain strong, reaching all time highs on 08.15.16 and then closing the month, on average, 1% from those highs.
• U.S. Corporate results for Q2 2016 were mixed with actual earnings and actual revenues beating estimates; however actual and estimated earnings growth continues to decline.
• Moving forward we expect asset price volatility during the month
PERFORMANCE
U.S. equity markets continued the trend of positive performance with support coming from multiple expansion instead of earnings growth. During August 2016, the Dow Jones Industrial Average, the S&P 500, and the Russell 3000 returned 0.26%, 0.14%, and 0.26% respectively.
As of 08.31.16 the S&P 500 trades at a 16.9x forward 12-month P/E ratio, a ratio that has been steadily growing since the end of Q3 2015.
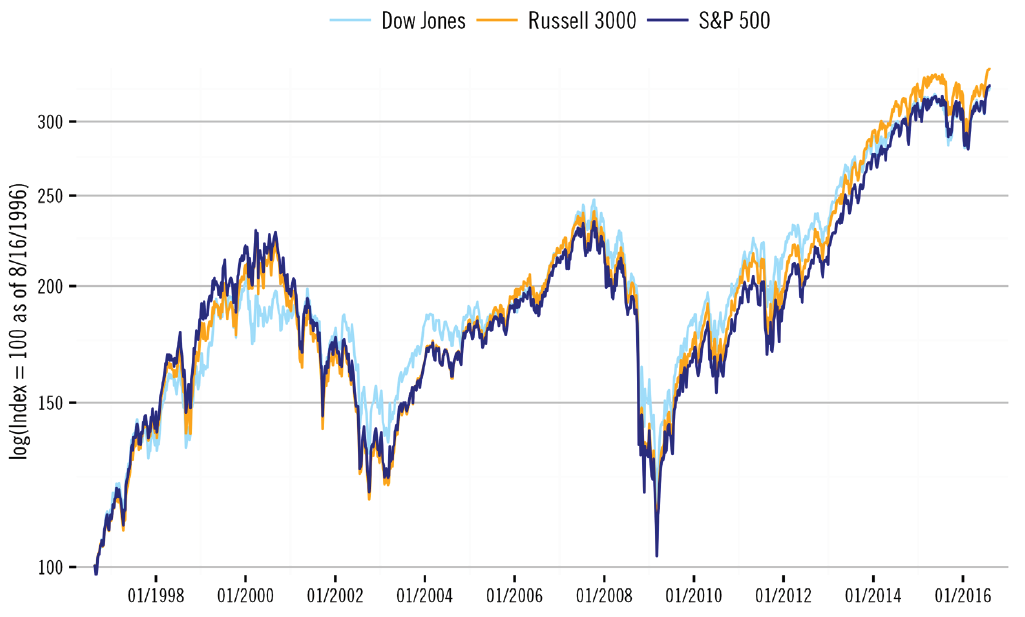
Figure 1 normalizes the S&P 500, Russell 3000, and Dow Jones to a value of 100 as of twenty years ago, and shows the magnitude of recovery that the prevailing bull market has regained since the most recent lows in 2008. The positive trend in U.S. equity markets has coincided with supportive monetary policy. As the market transitions into a month with three major central bank meetings, we expect an increased focused on the effect of monetary policy.
Figure 1 – INDEXED PERFORMANCE OF MAJOR U.S. EQUITY MARKETS OVER TWENTY YEARS
Monthly price return data from 08.16.1996 to 08.16.2016 SOURCE: Innealta Capital using data from FactSet Research Systems Inc.
ASSET COMPARISON
A comparison of major asset class levels shows that equities, credit, and fixed income sovereign currently trade above their respective 5-year average, while commodities trade below their average levels. Figure 2 displays a comparison of different asset classes by normalizing the current values using Z-scores generated from 5 years of each markets’ history.
The immediate observation is the divergence inforeign exchange relative to the U.S. dollar. At the top of the diagram, we see that the U.S. Dollar is able to buy significantly more GBR Pounds in comparison to the average level over the last 5 years. U.S. Dollar strength relative to the GBR pound is a recent phenomenon following the results of the “Brexit” referendum in late June. The data also highlights the flattening of the U.S. Treasury 2 – 30-year yield curve. The 30-year yield is below while the 2-year yield is above the 5-year average, suggesting an upward yield shift on the short end of the curve and a downward yield shift on the long end of the curve. Despite a recent rally, Gold, Natural Gas, and Oil markets still remain below their respective 5 year average.
Figure 2 – NORMALIZED CURRENT ASSET LEVEL, OVER A 5-YEAR LOOK-BACK PERIOD
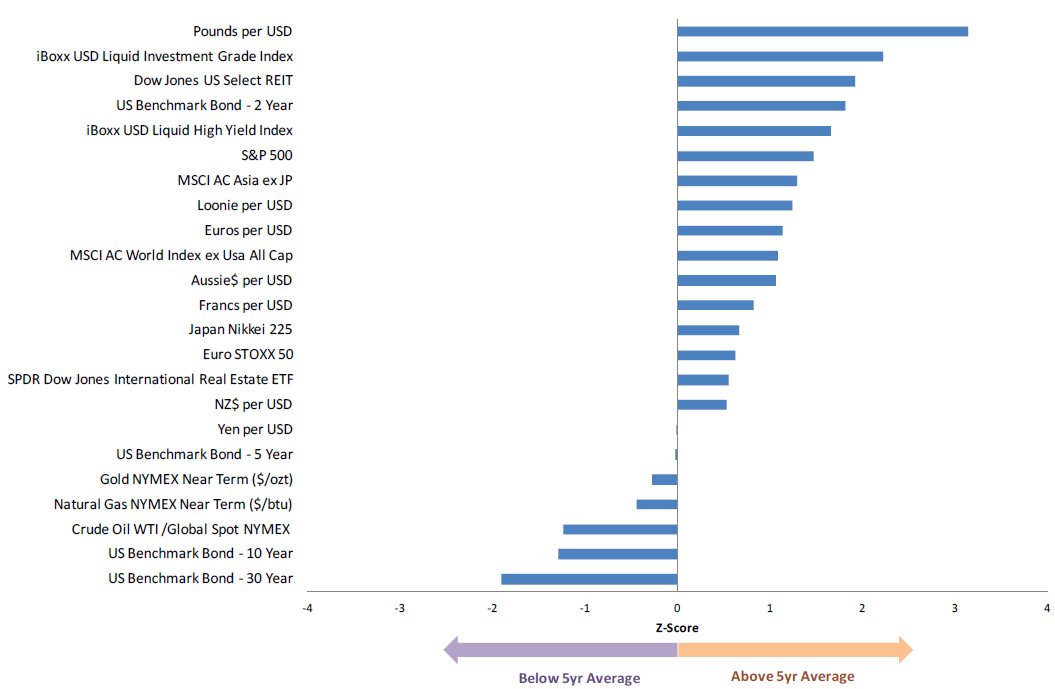
Weekly price and yield data from 09.02.2011 to 08.26.2016 SOURCE: Innealta Capital using data from FactSet Research Systems Inc.
EARNINGS EXPECTATIONS
Corporate results from Q2 2016 showed that revenue and earnings beat estimates; however market expectations of future earnings growth remains weak. As of 08.26.2016, 98% of S&P 500 constituents have reported earnings for Q2 2016. 71% of those firms reported earnings that beat the mean estimate and 53% reported sales above the mean estimate. Looking ahead to Q3, 77 S&P 500 firms have already issued negative EPS guidance and 33 S&P 500 firms have issued positive EPS guidance.
Figure 3 shows a S&P 500 Sector Expectations Scorecard for Q2 2016. In this plot, the individual sectors of the S&P 500 are compared against their composite index on the basis of earnings and sales expectations. The largest number of positive earnings and sales surprises came from Tech and Healthcare sector firms, while sales and earnings results in Utilities and Telecom fell short of expectations.
Figure 3 – S&P 500 Q2 2016 EXPECTATIONS SCORECARD
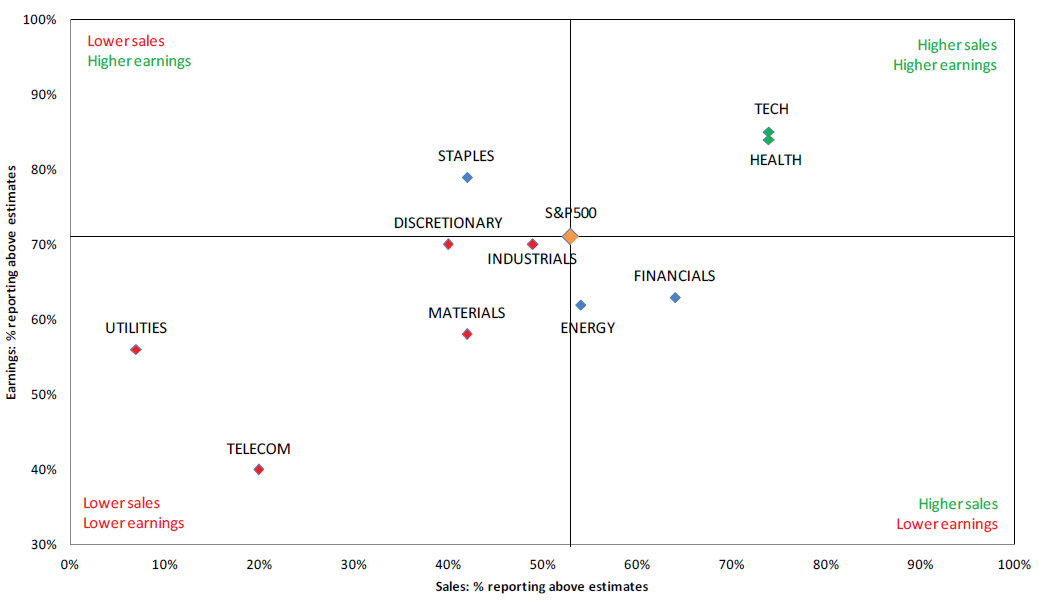
Data as of 08.26.2016 SOURCE: Innealta Capital using data from FactSet Research Systems Inc.
EARNINGS GROWTH
Despite the positive news of corporate results relative to expectations, actual and expected earnings growth remains a concern. For the second quarter, the year-over-year earnings decline for the S&P 500 is -3.2%, though the estimated earnings decline for the quarter was -5.5%.
In fact, Q2 2016 marks the first time since The Great Recession of 2008 that the S&P 500 has posted five consecutive quarters of year-over-year declines in earnings (Q3 2008 through Q3 2009).
Forward 12-month EPS has fluctuated around $125.00 for 2 years, the most recent estimate is $128.77. However, as evidenced by Figure 4, growth in forward earnings expectations has fallen off significantly since Q4 2010, and currently stands at 0.9%.
Figure 4 – ROLLING FORWARD 12-MONTH EXPECTED EARNINGS YEAR-OVER YEAR CHANGE (%)
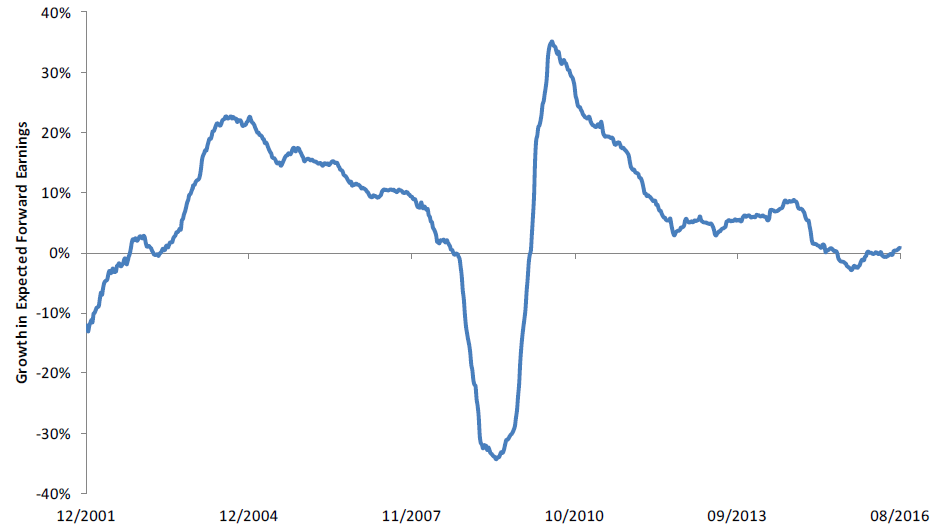
Weekly price and EPS data from 12.28.2000 to 08.26.2016 SOURCE: Innealta Capital using data from FactSet Research Systems Inc.
LOOKING FORWARD
Monetary policy has been a key driver for asset performance over the past several years, and with three major central banks holding meetings we expect September to be an exciting month, especially after the Fed’s lackluster rhetoric from Jackson Hole.
During her speech, Fed Chairperson Janet Yellen said that she sees a stronger case for increasing the Fed Funds Effective Rate (FFER) in the near future. We must exercise patience to see whether or not this will come to fruition. The last increase in the FFER came in December of 2015, at which time the market forecasted four more increases in 2016. We are still waiting for the first increase in 2016. The implied probability from the Federal Funds Futures market of a 25 basis point interest rate hike in September increased from 19.2% to 35.7% during the month of August.
