Note: This article is part of the ETF Trends Strategist Channel
By Clayton Fresk
Every day there seems to be another strategic beta fund (or family of funds) coming to market, of which the newest trend appears to be multi-factor funds. It can be an intimidating task filtering through the various names to determine the differentiating factor between them all. In addition, even after running through this task, is there enough differentiation to further help make an allocation decision? I will examine the strategic beta landscape as we sit today.
In the following analysis, I used the Morningstar Strategic Beta classification system. While the system itself is not new, it is a quantitative way to slice and dice the universe. A full report outlining the classification system can be found at: https://corporate.morningstar.com/US/documents/Indexes/Strategic-Beta-Landscape.pdf
For purposes of this article, I am going to focus on Equity ETFs only. As of 5/18, there were 1126 US ETPs classified as Equity (excluding leveraged and inverse ETPs). Within this group, there were 493 classified under the Strategic Beta Group. So approximately two out of every five equity ETPs fall under the Strategic Beta umbrella.
That’s the easy part.
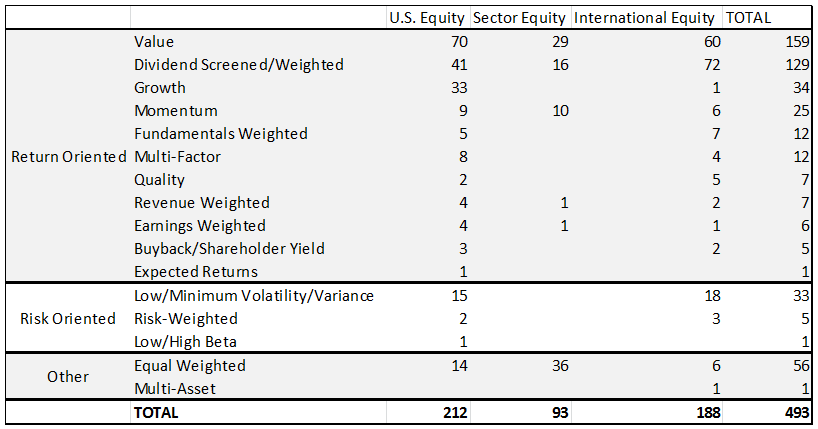
Now the classification gets a lot more granular. From there, the first attribute is Return Oriented, Risk Oriented, or Other. Under each of those is a subset of attributes:
However, a single ETP can have multiple attributes within this subset (there are five ETPs that have six separate attributes attached to them). Similar to the Morningstar analysis, here is a breakdown by the 2nd level attribute, broken down by US, Sector, or International exposure:
A large majority of the names have a Return Oriented methodology with various attributes, while the other groups consist mainly of Low/Minimum Volatility or Equal Weighted names.
As I mentioned, a plethora of Multi-Factor names have come to market. By digging further into the attributes, 174 Equity ETPs have Multi-Factor as an attribute at one level or another.
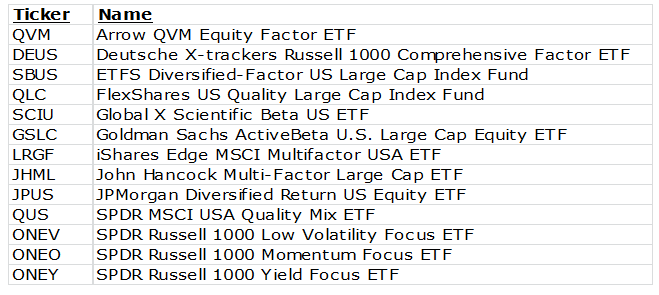
To give an example of the array of options an investor has to choose from, here are a list of US Equity Large-Cap Core funds with 2nd attribute of Value and 3rd Attribute of Multi-Factor (so a rather specific filter):
A question that could arise from here is how much differentiation is there between these choices? The obvious source of discrepancy will be the underlying methodology, which of course is the selling point for each of the names. There will also be some discrepancy from which base index is being utilized (i.e. S&P 500 vs Russell 1000 vs MSCI USA).
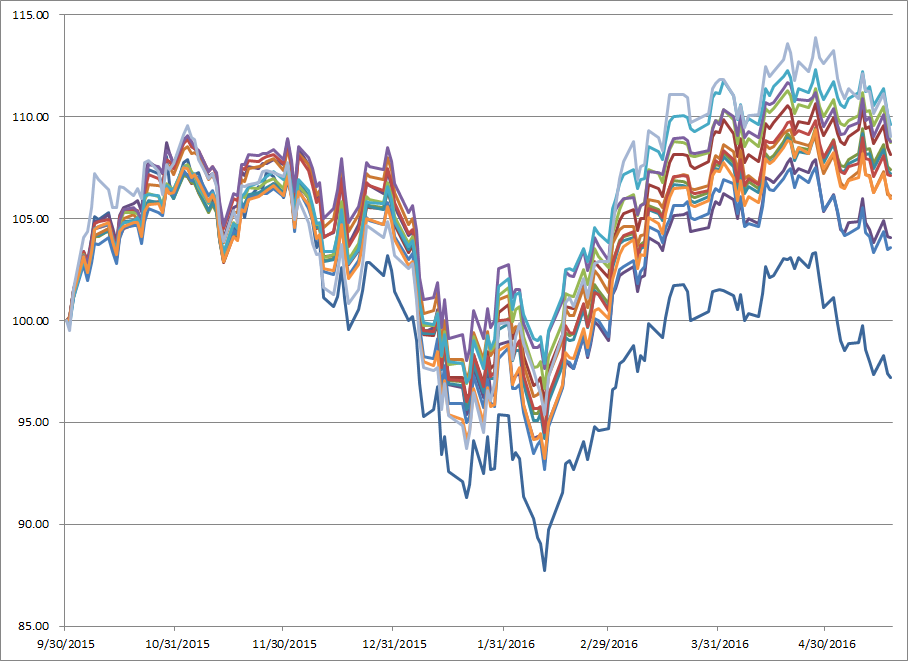
While knowing this is a short dated analysis, here is a return chart of the underlying indices for each of the above listed names since the end of 3Q15.
While there are a couple outliers, the range of returns is decently tight and most of the return streams are correlated.
This was only one view into a rather minute section of the Strategic Beta landscape. How to fit all of the other pieces (non-US, fixed income, commodities, etc.) into an allocation and choosing whether to utilize strategic beta at all can end up being a daunting task.
Clayton Fresk is a Portfolio Manager at Stadion Money Management, a participant in the ETF Strategist Channel.
Past performance is no guarantee of future results. Investments are subject to risk, and any of Stadion’s investment strategies may lose money. The investment strategies presented are not appropriate for every investor and financial advisors should review the terms and conditions and risks involved. Stadion’s actively managed portfolios may underperform during bull markets. Some information contained herein was prepared by or obtained from sources that Stadion believes to be reliable. There is no assurance that any of the target prices or other forward-looking statements mentioned will be attained. Any market prices are only indications of market values and are subject to change. The S&P 500 Index is the Standard & Poor’s Composite Index of 500 stocks and is a widely recognized, unmanaged index of common stock price. The MSCI USA Index is designed to measure the performance of the large- and mid-cap segments of the US market. With 625 constituents, the index covers approximately 85% of the free float-adjusted market capitalization in the US. The Russell 1000 Index is a stock market index that represents the highest-ranking 1,000 stocks in the Russell 3000 Index, which represents about 90% of the total market capitalization of that index. It is not possible to invest directly in indexes (like the S&P 500) which are unmanaged and do not incur fees and charges. The Sharpe ratio measures the excess return per unit of deviation, or risk. Any references to specific securities or market indexes are for informational purposes only. They are not intended as specific investment advice and should not be relied on for making investment decisions. SMM-062016-335
Founded in 1993, Stadion Money Management is a privately owned money management firm based near Athens, Georgia. Via its unique approach and suite of nontraditional strategies with a defensive bias, Stadion seeks to help investors—through advisors or retirement plans—protect and grow their “serious money.” Contact Stadion at 800-222-7636 or www.stadionmoney.com.