Note: This article appears on the ETFtrends.com Strategist Channel
By Rick Vollaro
Vertigo is a condition that makes people feel like objects around them are spinning when they are not, and it generally leaves people feeling dizzy. Recently it hit me that trying to analyze U.S. economic data was giving me vertigo, since the only consistency in the data seems to be pure inconsistency. For instance, yesterday I was parsing a few data points that registered on the Bloomberg. Here’s a smattering of what gave me market indigestion.
Chicago Fed National Activity Index
This indicator includes 85 different economic variables, and should act as a decent one-time snapshot of U.S. economic activity. Positive numbers are good and negative, not so good. The latest estimate from economists was for -.15, but the number printed a soggy -.44. Not a great number for economic bulls looking for the economy to explode back up.
Initial Jobless Claims
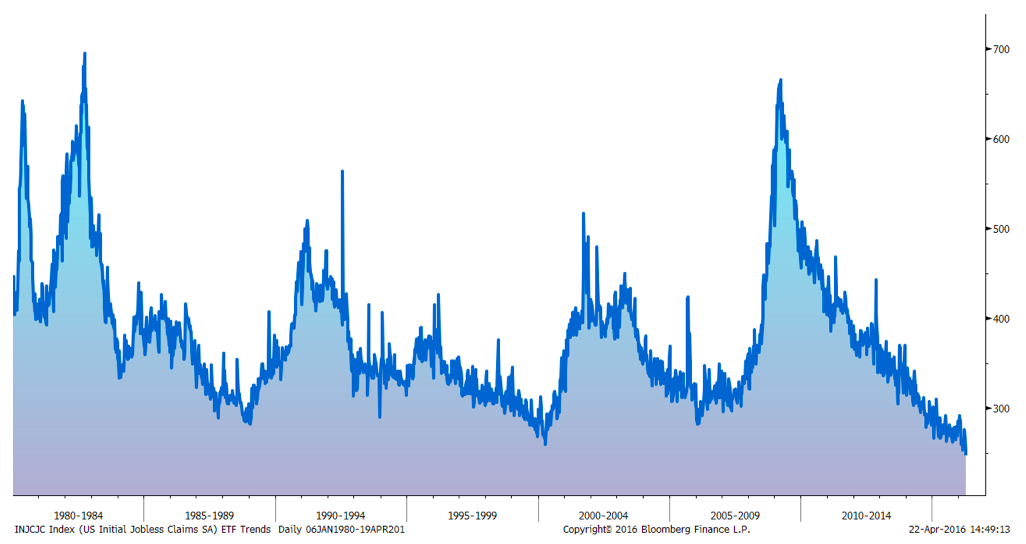
Jobless claims have been one of the better leading barometers of the job market and for the overall economy. Yesterday the initial jobless claims number plummeted to 247,000, which is the lowest level since 1973. The continuing claims number also dropped more than expectations on the week.
Philadelphia Fed General Business Activity Index
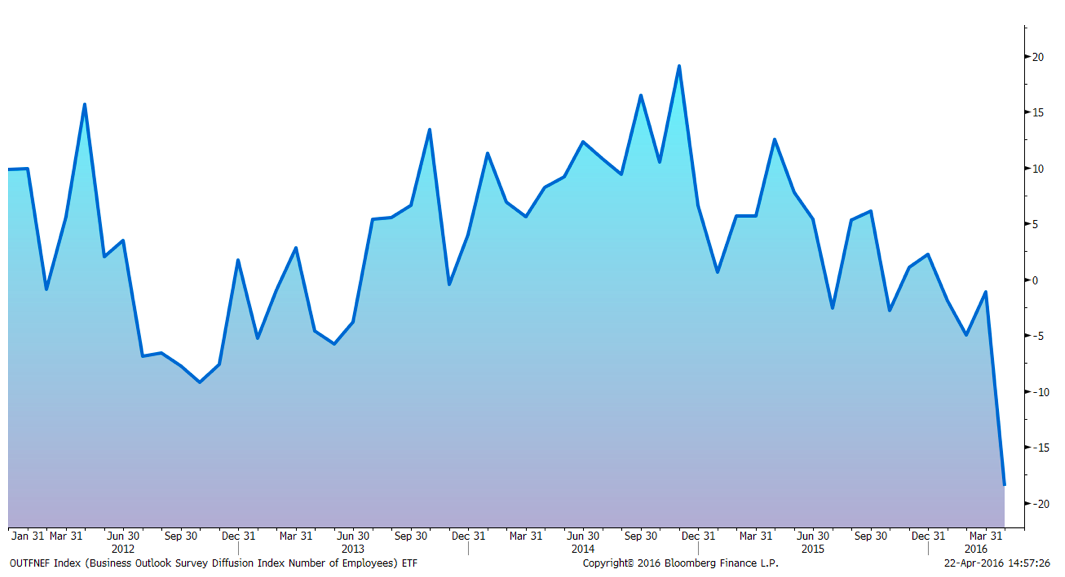
If you happen to think that the labor markets look pretty solid and we can cast aside the Chicago numbers mentioned above, not so fast. The Philly Fed came in at -1.6, which was way under the consensus for a +9. Last month this series had reversed from a multi-month slump and surprised consensus to the upside. For those looking for some persistence that this data has turned the corner to the upside, this number turned out to be a dud. The employment number within the series also plummeted and doesn’t jive at all with the aforementioned claims number. If one is to read into this, maybe any anticipation of an uptick in production is a fantasy?
Conference Board Leading Economic Index
We believe leading indicators are extremely important, so it was nice to see the conference board’s leading economic index bounce in an upward direction and register a +.2%. That being said, it did miss expectations, and the prior month’s revision was downgraded from positive to negative territory.
Coincident to Lagging Index (Co/Lag)
The conference board also updated their coincident and lagging indicators, and the ratio of the coincident to lagging data (Co/Lag) is widely considered another leading series of data. Since the coincident numbers were flat while lagging economic indicators picked up, the Co/Lag crashed to its lowest level since the mid 1970’s. So much for feeling too positive about the economy when looking at this data point…
GDP-Our Best Guestimate for Q1/Q2
Right now U.S. economic data is as whippy and trendless as the financial markets, which is making a difficult forecasting exercise even more hazardous. Our current take is that growth in the U.S. is stuck in a very low growth zone, which has been oscillating from downright nasty to mediocre the last few years. Our forecast for 1st quarter GDP is anemic—somewhere in the range of zero to one and a half percent. That’s not good, but we do think there is a chance that data may reflexively bounce a bit back towards 2 percent in the second quarter due to stabilizing financial conditions, a lower U.S. dollar, and some regional surveys that bounced hard last month. Nevertheless, conviction is not very high in this forecast, given how volatile the current data has been.
Like many investors, we are hopeful that a trend will eventually establish and the cycle can find some normal footing. Until it does, investors will have to do their best to parse through the data carefully and avoid big mistakes while this economic vertigo persists.