Value is an engrained investment methodology loyally followed by many with varied methods of measurement (e.g. P/B, P/E, P/Cf). Simply, value represents the undervalued stocks in a given universe and is historically recognized as having a slice of the investment marketplace. Growth is value’s counterpart and in most cases they do not overlap.
Growth often represents measurements of the change in price of a security. The recent popularity of factor ETFs has attracted more attention to these market segment as there are multiple ETFs using growth and/or value as a factor in their methodology (single or multi-factor). Asset managers with a broader asset allocation focus often attempt to find the right time to over and underweight growth and value.
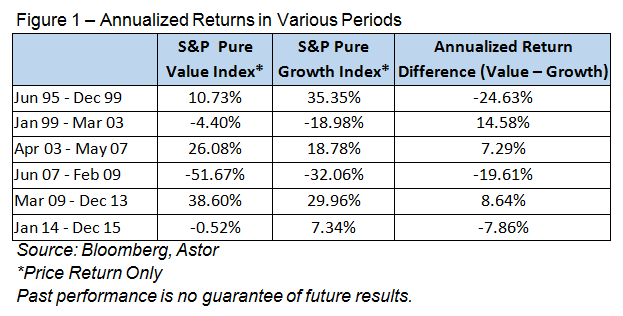
When observing the performance of these two methodologies over recent decades, there are often significant periods of under and overperformance relative to each other (See Figure 1). Since 1995 (when data for the Pure indices is first available), there have been several economic and market cycles. In the lead-up to the tech bubble, tech stocks helped growth outpace value by over 24% on an annualized basis. When the tech bubble burst, stocks in general suffered losses, the impact to value was less. Value and growth flip-flopped in the following expansion period of 2003 to 2007 and in the next downturn during 2007 to 2009. As financial markets recovered from the Great Recession, value outpaced growth from the lows in 2009 until the end of 2013. Since then, growth has had the upper hand.
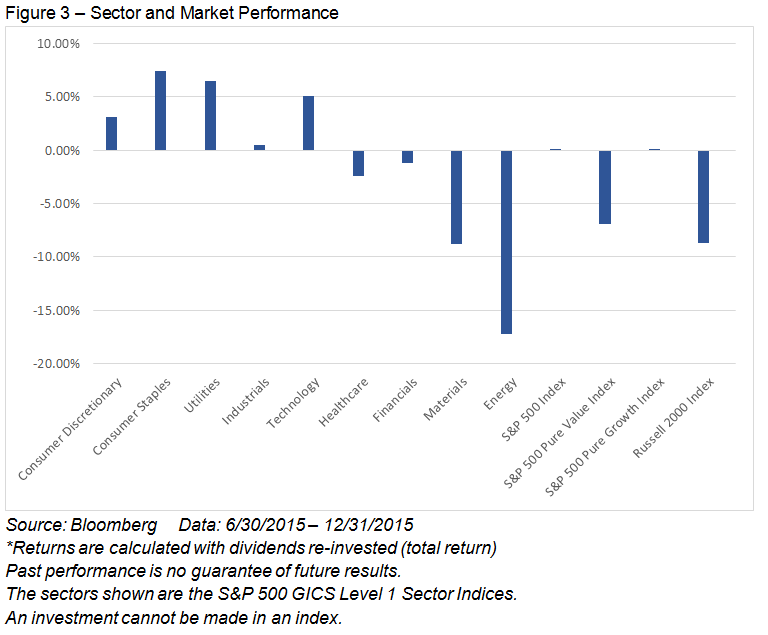
By most measurements, 2015 ended two years of less than desirable performance for value stocks even with subdued returns for growth stocks. Due to a stable but uneven economy, returns for U.S. GICS-classified sectors have seen dispersion. This economic environment has contributed directly to growth’s more recent outperformance. Technology stocks (mainly those with large market capitalizations) outperformed the broader market and comprised a large portion of the stocks within growth indices.
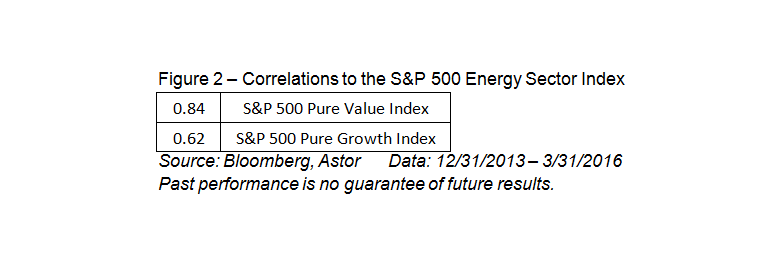
On the other hand, the energy sector has complicated the situation further by being both the victim and the perpetrator in the markets and economy. Lower energy prices have been the victim of slack global demand, excess supply, and excess capacity. Weakness in the energy sector has also caused a drag in other sectors. Industrial and materials companies have suffered from energy’s woes as has the financial sector. The energy sector is a much larger portion of the S&P 500 Value Index than the S&P 500 Growth Index. Figure 2 shows a higher correlation between the S&P 500 Energy Sector Index and the S&P 500 Pure Value Index than the Pure Growth Index.
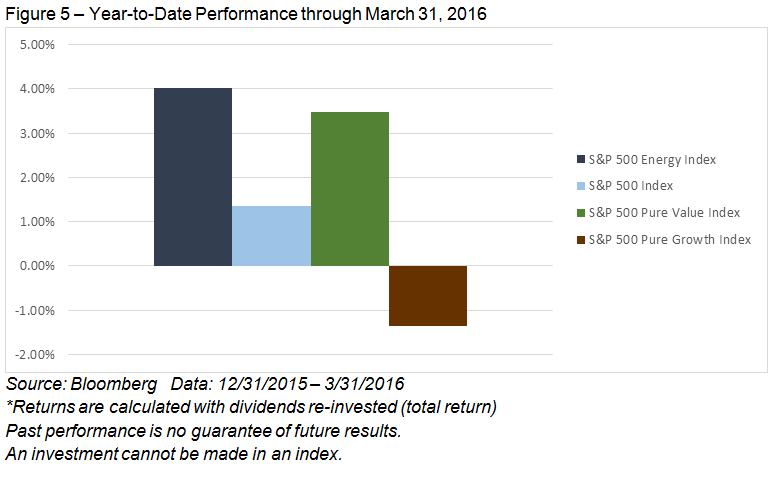
A number of ingredients created a catalyst for a decline in equity prices in January and February as well as a further drop in energy prices. The S&P 500 Energy Index hit a low point for the year on January 20th while broader equity benchmarks closed lower in early February. The outperformance of energy stocks during the period shown in Figure 4 helped push value stocks over growth on a year-to-date view as shown in Figure 5.
While it is challenging to specifically identify the type of environment where value will outperform growth (and vice versa), it is clear there are definable periods in history with substantial dispersions in both directions. The current “phase” has been in play for over two years with particular reasons as discussed earlier. The trend may continue for the near future, but the recent divergence in returns may signal a turning of the tide.
Bryan Novak is the Senior Managing Director & Portfolio Manager at Astor Investment Management, a participant in the ETF Strategist Channel.