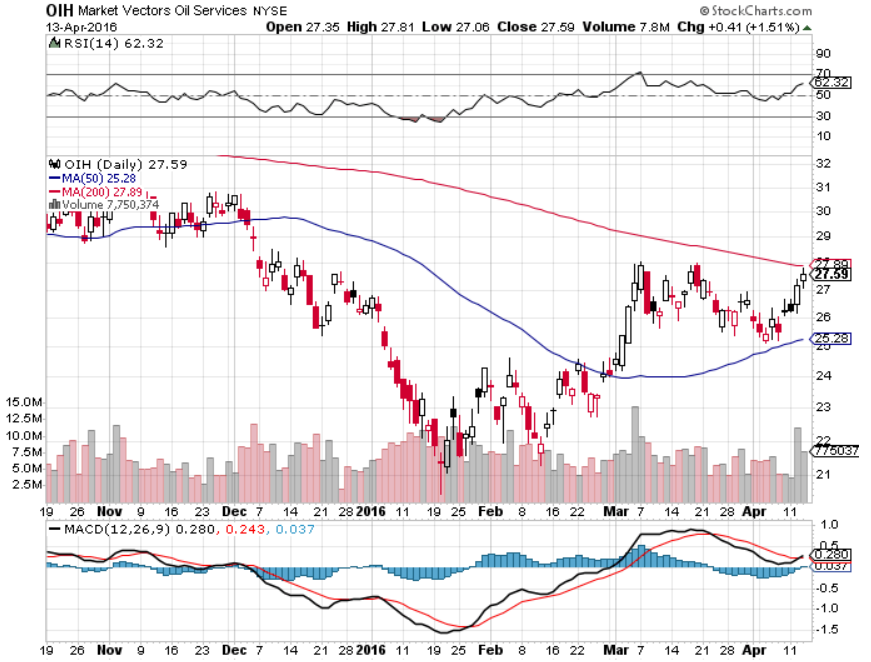
“Note that while the trend has been decidedly lower since oil and oil services stocks topped out in the summer of 2014, a real breakdown below multiyear support did not occur until last summer. After exhausting this swan dive, the OIH then began to bounce in January, and while overbought in the nearer-term, a possible upside target from this bigger picture view may well be the horizontal line (in other words, former support becomes resistance),” according to InvestorPlace.
With low oil prices pressuring oil producers’ bottom line, industry experts expect capital spending on new projects to decline by 20% and 30% on average, according to Wood Mackenzie, an energy consultancy. The consultant calculated that about $220 billion in investments have been cut so far, or $20 billion more than previously estimated two months ago, after the recent price declines.
“Tuesday’s 3.5% rally managed to push the OIH back above diagonal resistance that stretches back to 2014, which now puts the red 200-day MA on the map as a next upside target. This moving average currently resides around $28.40 area, and if targeted, would mean another 5% or so of upside for active investors and traders to sink their teeth into,” adds InvestorPlace.
Market Vectors Oil Services ETF
