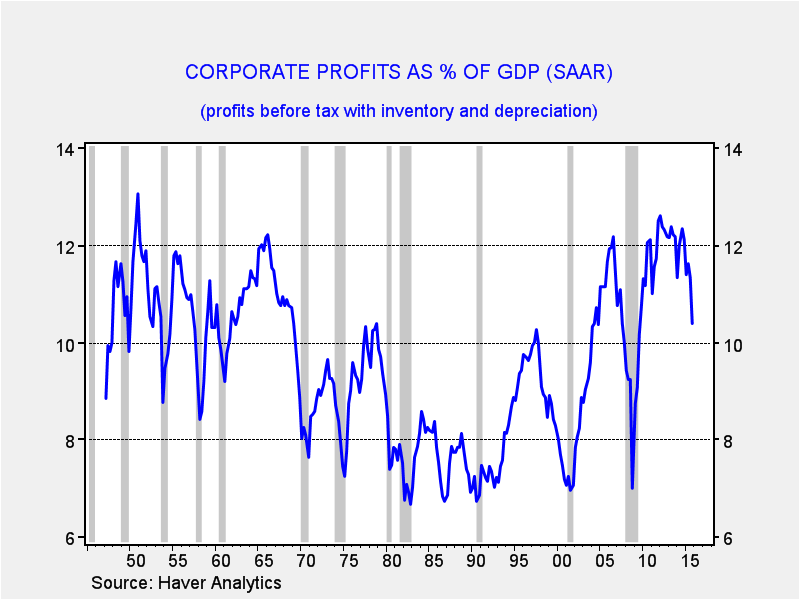
In the most recent Gross Domestic Report (GDP) report, corporate profits plunged.
The overall decline in profits was $153 billion in Q4, although some of this drop was due to an $83 billion settlement that BP had with the government over the 2010 Gulf of Mexico oil spill.
We have been noting for some time that profit margins have been eroding. This data tends to confirm that concern.
In our earnings forecast, we use a similar number from the National Income and Products Accounts (NIPA) that is similar to the above profits report except that it includes corporate taxes as well.
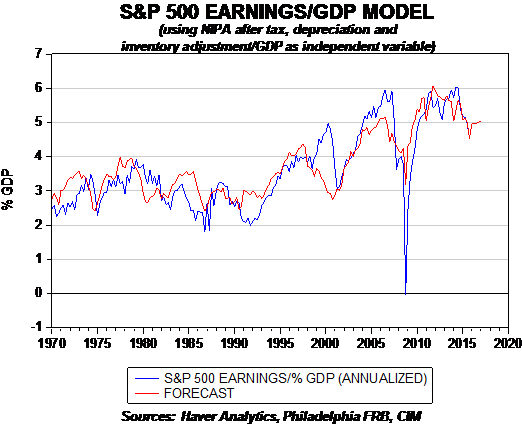
This chart shows the relationship between S&P 500 earnings as a percentage of GDP and the NIPA corporate profits after tax, depreciation and inventory adjustment. We include this variable in a larger model that we use to project S&P earnings compared to GDP.
For the most part, the two series tend to track each other rather closely. Periods when S&P earnings greatly exceed the NIPA numbers tend to signal that such divergences are not sustainable and they are resolved by a drop in S&P earnings. Such divergences are evident in 1980, 2000 and 2007. Fortunately, the two readings are not currently diverging.
Using the NIPA profits and GDP forecasts from the Philadelphia FRB, the relationship suggests that profits will recover in 2016.
In our latest update to our 2016 outlook, we reduced our earnings for the year mostly due to margin contraction. The most recent GDP data generally confirms this trend.
Overall, we are looking for a mostly flat year for the equity markets due to sluggish economic growth and mostly flat margins. At the same time, we do not expect a recession this year, which should prevent a major pullback in equities.
Bill O’Grady is an Executive Vice President and Chief Market Strategist and Kaisa Stucke is an Investment Strategist, both at Confluence Investment Management, a participant in the ETF Strategist Channel.
Past performance is no guarantee of future results. Information provided in this report is for educational and illustrative purposes only and should not be construed as individualized investment advice or a recommendation. The investment or strategy discussed may not be suitable for all investors. Investors must make their own decisions based on their specific investment objectives and financial circumstances. Opinions expressed are current as of the date shown and are subject to change.
This report was prepared by Bill O’Grady and Kaisa Stucke of Confluence Investment Management LLC and reflects the current opinion of the authors. It is based upon sources and data believed to be accurate and reliable. Opinions and forward looking statements expressed are subject to change. This is not a solicitation or an offer to buy or sell any security.