Though the global markets for risk assets, such as stocks, commodities and high yield bonds, have rebounded since February 11, our portfolios remain relatively cautiously positioned.
The sharp rally in risk assets has caused many of these markets to go from showing signs of being oversold to being overbought in the short-term. At this time, we think the world has additional risks to absorb in the near-term.
Positive signs in the U.S. labor market and increasing core inflation surveys are likely to motivate the U.S. Federal Reserve to increase interest rates again, possibly at its June 14-15 meeting. We think the markets will respond with volatility, as they did after the December rate hike. However, we do not think the Fed will be able to raise interest rates much further, easing some of the potential risks.
Therefore, we remain cautious and our portfolios are positioned more conservatively at this time. Looking ahead, we are starting to see opportunities for investments and anticipate putting some of our defensive capital to work on ideas that we think have more upside potential.
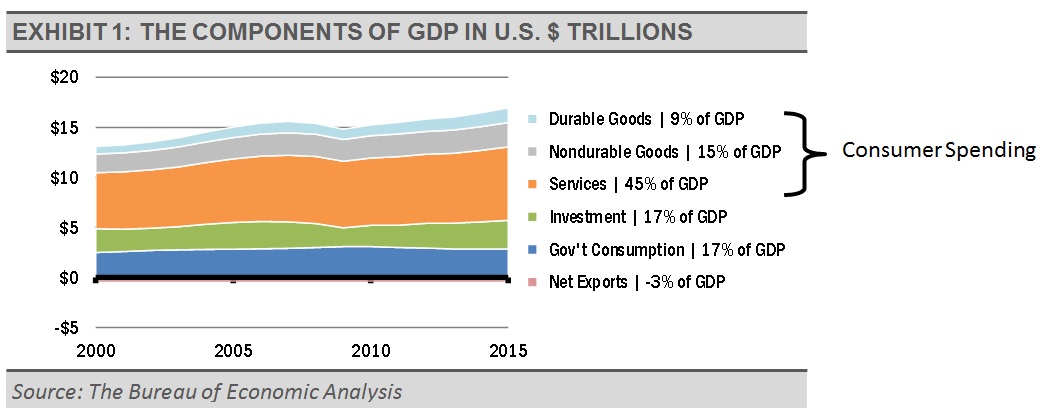
Expected volatility notwithstanding, we are excited about many investment options over the longer-term. Strength in the U.S. labor market can propel the U.S. economy forward despite potential headwinds coming from abroad. As we suggested in our recent commentary, Why 2016 is not 2008, the U.S. economy in general is less reliant on foreign economies than other countries. Consumer spending is the biggest component of the U.S. economy.
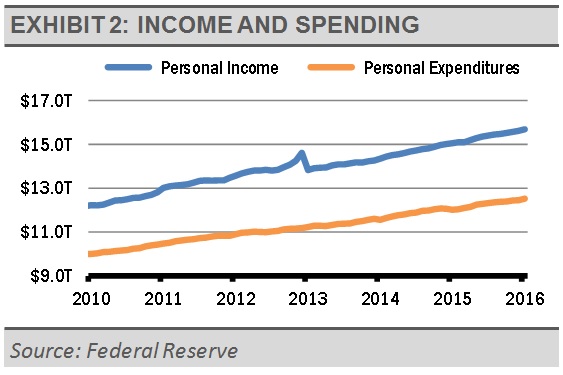
The U.S. consumer sector is strong. Jobs growth continues with well-paying jobs in the business and professional services, as well as health care and education areas. These advances should lead to an increase in disposable income and spending, along a healthy savings rate.
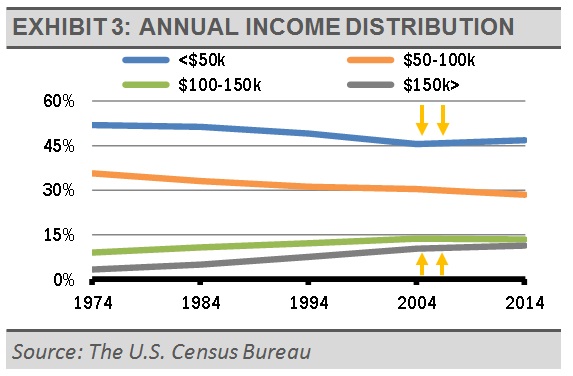
Importantly, this resulting income is spreading more broadly today. It is true that the percentage of U.S. households with annual income of $50k-$100k is shrinking, but data shows that this is because more households have moved up in the pay scale range. As the following income distribution graph shows, adjusted for inflation, over the last 40 years the percentage of households earning less than $50k and $50k-$100k per year has decreased, while the percentage of households in the earnings brackets from $100-150k and $150k+ has increased.