Note: This article is part of the ETF Trends Strategist Channel
By Rick Vollaro
For years, low oil prices have been considered an economic stimulant to economies that are heavy users of black gold.
But over the last few years, a major decline in oil has been unable to propel the world economy; some investors are wondering why the oil drop has not produced a burst in consumption from the U.S. and global economies.
It can’t be denied that lower gas prices in the U.S. and abroad should amount to an enormous cash infusion for consumers, but decelerating world growth rates are currently flying in the face of the conventional wisdom that low oil should lead to a pickup in economic activity.
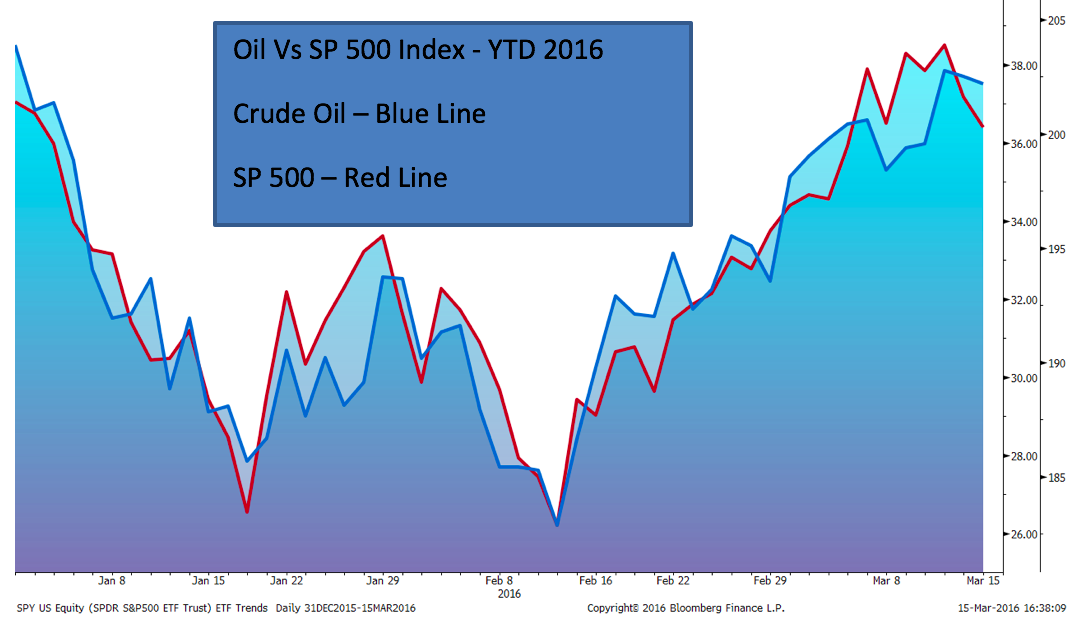
Investors are also watching another short term oil based conundrum unfold, and that comes in the form of a rapid rise in the correlation between oil and the stock market.
According to data obtained from Ned Davis Research, since 1983, the historical correlation between oil and the total return of the Dow Jones Industrial Average has been approximately .09, implying that over longer periods of time there has been little correlation between oil and non-commodity based equities.
But since the start of the year that correlation has exploded to .58, and on many days we have observed the two markets acting as though they are linked at the hip. The movement between the two is clearly an aberration in relation to history, but why is it happening?
One theory that seems to make some sense is that the market is currently viewing the drop in oil as a reflection of collapsing commodity prices and a world devoid of aggregate demand.
When viewed through that prism, the market may rightly be focusing on the shorter term consequences of oil based debt defaults that could overwhelm the positive effects of lower gas prices for consumers.
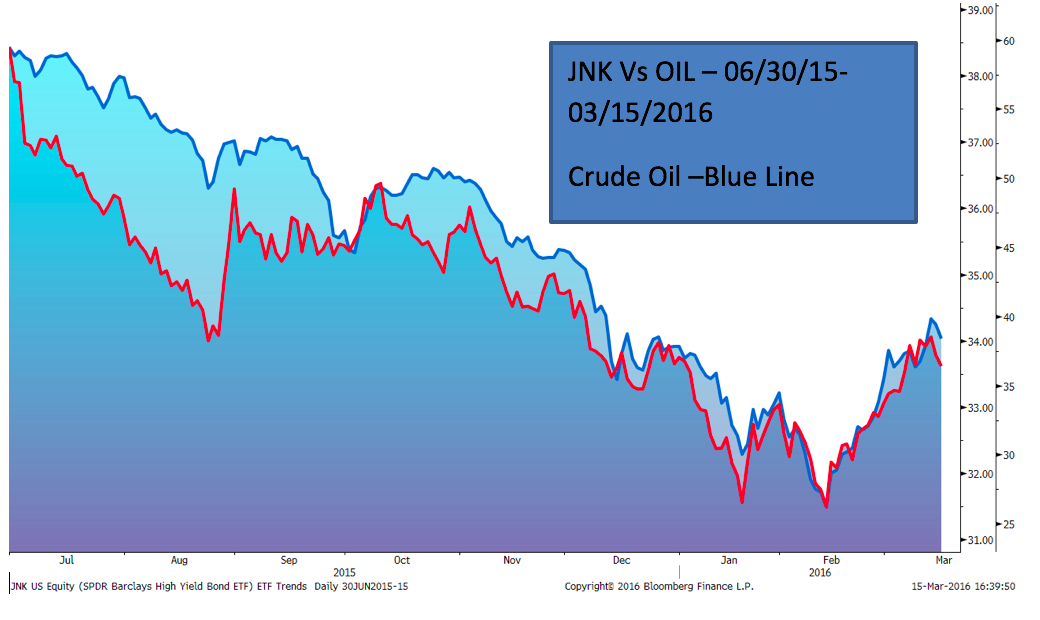
One confirmation that this thesis is on the right track can be seen in high yield bond indices that have a concentration of energy holdings, and have been plunging along with oil and gas for multiple quarters now.
Like equities, the longer term historical correlation between High Yield and oil is somewhat low at .17 but has recently jumped to approximately .52 during 2016 (again, according to data from Ned Davis Research).
One last angle to consider is the amount of program trading that now occurs on a day to day basis. In a world where computers are moving markets, it is fair to say that algorithmic trading may have something to do with watching oil and stock markets moving in tandem. Eventually we would expect this short term spike in correlations to run its course, much like the direction of the Euro and stock prices did after the European crisis of 2011 began to calm down. But until the correlation breaks and computer trading systems change their calculations, a view on oil will likely be synonymous with a view on equity markets. So if you want to know where markets are headed in the shorter term, keep watching oil.
Note: Our next article will cover our view of whether crude oil has truly bottomed, or is just in the midst of a dead cat bounce. Stay tuned.