The month of March brings the focus of the sport’s world on college basketball’s “March Madness.”
The upsets, the drama, and the buzzer-beaters during the NCAA basketball tournament capture the imagination of even the casual fan.
Filling out, comparing, and bragging about tournament brackets dominate conversations around the water cooler for weeks. There are a variety of strategies that go into completing a tournament bracket.
There are 68 teams competing for the title of champion. Even the most devoted college basketball fan is unfamiliar with a majority of the teams. Therefore, most fans rely on the seeds given to each team by the tournament selection committee when picking a winner of a particular matchup. In fact, one of my daughters was the winner of our family bracket a few years ago by simply picking the higher seed in each matchup.
However, picking the favorite is not foolproof, as there are years with jaw-dropping upsets. The 2016 tournament has had the most first round upsets since 2001.
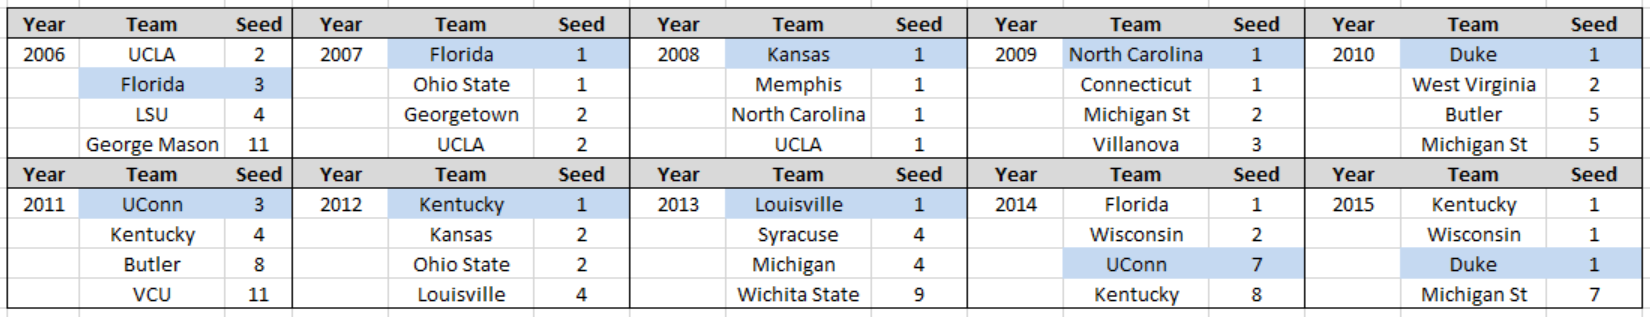
While most of us cheer for the underdog, a review of the past 10 years of Final Four teams reveals some interesting data. There have been 40 final four teams from 2006-2015.
Fifteen of the 40 teams were number one seeds. The average seed for a final four team over the past decade is 3.3. Seven of the past 10 national champions have been “1” seeds, two champions have been “3” seeds, and one champion was a “7” seed. While upsets grab headlines in early rounds, it is the higher seeds that typically advance to the final four and win the championship.
Final Four Teams & Seeds 2006-2015; National Champion in Blue:
What can we learn about ETF investing from a review of March Madness and tournament brackets? Many investors allocate their investment portfolios the same way they fill out their tournament brackets. Many investors identify the asset class, sector, or ETF that performed well the previous year, and they allocate to the “top seeds” in the coming year.
Others relish picking the underdog, and they seek to emphasize asset classes with the “lowest seeds” from the previous year.
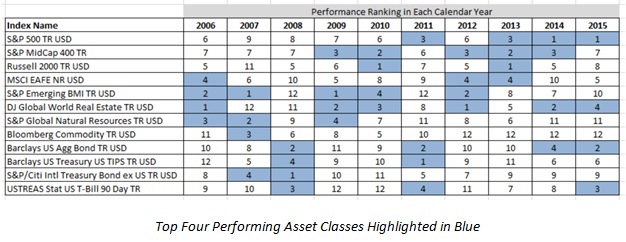
Professor Craig Israelsen, creator of the 7Twelve portfolio, identifies 12 broad asset classes: U.S. Large Cap Equity, U.S. Mid Cap Equity, U.S. Small Cap Equity, International Developed Equity, Emerging Market Equity, Global Real Estate, Global Natural Resources, Commodities, U.S. Bonds, U.S. TIPS, International Bonds, and Cash. How have these asset classes performed in the market’s investment bracket over the past ten years?
When reviewing these 12 asset classes from 2006-2015, the “top seed” from the previous year (best performing asset class) had an average finish of 6.7 out of the 12 asset classes the next year. Only on one occasion did the top performer of the previous year repeat as the top performer the next year (U.S. Large Cap in 2014 and 2015).
What about the strategy of picking the lowest seed from the previous year (poorest performing asset class) for the next year? The 12 seed from the previous year had an average finish of 7.9 out of the twelve asset classes the following year. There was one case of worst to first. In 2008, Emerging Market Equity was the poorest performer, and it became the top performer in 2009.
Of the 12 broad asset classes listed, no asset class finished first more than two years over the past decade (U.S. Large Cap, U.S. Small Cap, Emerging Markets, and Global Real Estate each finished first twice; U.S. Bonds and International Bonds each once). The asset class with the highest 10-year return (U.S. Mid Cap) was never the top performer in any individual year.
This asset class data highlights the value of a diversified investment portfolio. Unlike the NCAA tournament where the top seeds often reach the final four and are crowned champions, the top performing asset classes are not necessarily the same from year to year. Each asset class has characteristics that favor differing economic and market seasons. Asset class diversification offers the potential to enhance a portfolio’s risk-reward profile. Adding a layer of tactical management offers the potential to augment investment opportunities and portfolio protection.
While NCAA tournament brackets require a fan to pick a single champion, investors constructing diversified investment portfolios do not face a similar constraint. A winning investment bracket is more similar to constructing a team of 12 players, each playing a valuable role towards the success of the portfolio.
[related_stories]We should not forget that ETFs have completely revolutionized the market’s investment bracket. In the past, deep asset class diversification was only available to large, institutional investors. ETFs allow an educated investor and a careful financial advisor to efficiently and inexpensively access a broad spectrum of asset classes and sub-asset classes.
Many diversified, tactical strategies are now equally available to all types of investors. Utilizing the large opportunity set of ETFs that are targeted, traded, and transparent is the equivalent of expanding the tournament bracket from eight teams to its current 68 teams!
My NCAA Tournament Bracket is already “busted” for this year, but a diversified ETF portfolio never goes out of season. Amidst the buzzer beaters that punctuate basketball victories this time of year, don’t forget to celebrate one of the true investment champions: the diversified ETF portfolio.
John Lunt is the President of Lunt Capital Management, a participant in the ETF Strategist Channel.