Most commentary on the high yield bond space has closely examined the energy sector and justifiably so. The energy sector was (until its recent large losses) a large weight in most high yield ETFs, and the sector’s weakness has been dramatic. However, many stock market and equity market bulls have often made the case that the weakness in the energy sector is “isolated.” In this article, we will present some examples that show that the weakness in high yield has been broad based, and we will also point to what we see as the lone sector that is showing encouraging signs (at least in the short term).
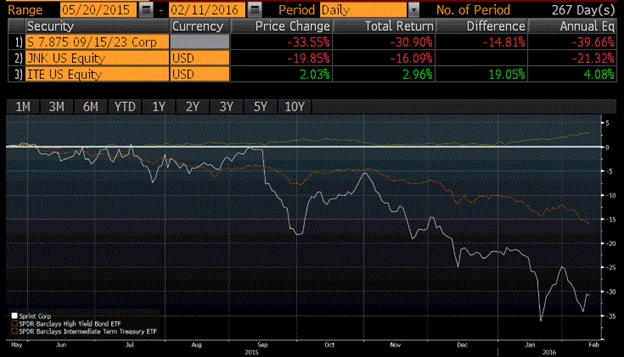
Let’s start by looking at an individual bond issuer in the high yield space, telecommunications giant Sprint. Sprint is a very large debt issuer and is persistently one of the top ten issuers in high yield bond ETFs. Telecommunications is perceived as a defensive, stable industry that can be a safe haven during hard times. However, a substantial debt burden and mediocre growth have put Sprint bonds under massive price stress, which was recently magnified by a ratings downgrade. Below you will see a chart that compares the Sprint 7.875% bond maturing in 2023 with a large high yield bond ETF, the Barclays High Yield Bond SPDR (JNK), and the Barclays Intermediate Term Treasury SPDR (ITE). The chart begins on May 20, 2015, the date of the S&P 500’s recent high, and runs through February 11, 2016. Over the chart’s nine-month time period, the Sprint bond declined 30.9%, much more than JNK, which declined 16.1%. Despite the telecommunications industry’s stable cash flows and perceived stability, Sprint bonds were big underperformers and were a negative contributor to JNK performance. Sprint bonds currently have a roughly 1.3% weight in JNK, and the bond shown in this chart is the largest single issue.
Before we move on to discuss sectors, we should consider just how much damage has been done in the high yield space. From May 20th to February 11th, high yield bonds as represented by JNK declined 16.1%, while a proxy for a core Treasury bond holding, the Barclays Intermediate Term Treasury SPDR (ITE), gained 3.0%. The 16% loss in high yield is a major loss of principal, particularly when you consider that bonds are the conservative part of an investor’s portfolio and are often used as conservative diversifiers to minimize losses during times of market turbulence. The extreme volatility that we have recently seen in high yield bonds emphasizes the point that the risks in this segment of the bond universe need to be managed very carefully. At Clark Capital in our Fixed Income Total Return program, we use a quantitative model to manage our high yield exposure. When the model indicates extreme stress in credit markets, we will shift portfolio assets into U.S. Treasuries or cash until the model perceives that market stresses have eased.
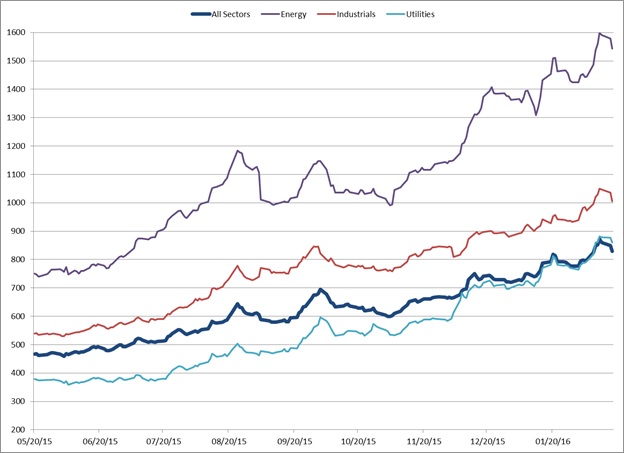
Since credit markets (and later equity markets) began to experience stress in June and July of 2015, Energy has been identified as the primary culprit. However, a broader look at pricing and spreads across all of the sectors in high yield reveals broad weakness. As seen in the chart below, since the S&P 500 peaked on May 20th, high yield bond option-adjusted spreads (remember: spreads move in the inverse direction of prices) have risen across multiple sectors. Energy, of course, has been the weakest, with spreads still at a remarkable 1500 basis points. However, the Industrials and even the Utilities sectors have seen widening spreads, with their spreads becoming wider than the all sectors measure of the high yield universe. In fact, since May 2015, every sector in the high yield universe has seen persistently higher option-adjusted spreads (and thus lower prices). Thus, while Energy has seen the most dramatic and headline-making losses, confidence in the entirety of the low quality credit universe has reached multi-year lows.
Finally, while a broader analysis of low quality credit conditions recommends caution, we wanted to point to one area where we have seen improvement: the Basic Materials sector. On February 11th high yield credit markets and the stock markets made what appears to be short-term lows. Within the high yield credit space, only one sector, Basic Materials, did not see its option-adjusted spreads make new multi-year highs (and thus price lows). Credit markets often lead equity prices and, on this basis, the Basic Materials sphere, which has been ravaged by the collapse in commodity prices, might deserve a closer look due to its impressive short-term relative strength. While there is no way to narrowly target the Basic Materials sector on the fixed income side, more aggressive investors might wish to examine equity ETFs in the space, including the Basic Materials Select Sector SPDR (XLB), Vanguard Materials ETF (VAW), or the Market Vectors Gold Miners ETF (GDX).
Mason Wev is a Portfolio Manager at Clark Capital Management Group, a Participant in the ETF Strategist Channel.