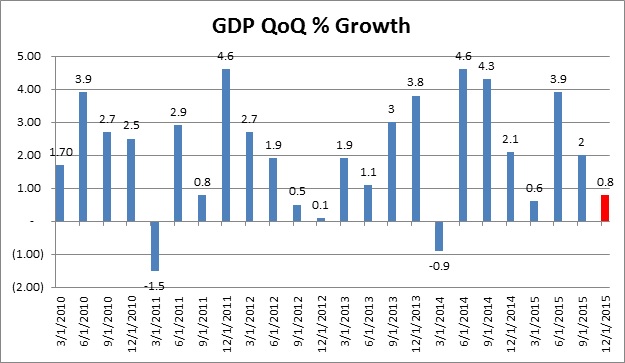
A recent CNNMoney survey of economists pegs the odds of the U.S. entering a recession this year at 18%. Considering the duality of the current market turmoil caused by Chinese capital flight and the propensity of news-outlets to give time and space to the most outrageous of economic doomsayers, it’s no wonder investors are scared. Yet, a reasoned analysis of economic data and a detached look at some historically viable indicators renders most of the recessionistas little more than false harbingers. A recession is defined as two successive quarters of economic contraction as measured by a decline in real Gross Domestic Product (GDP).
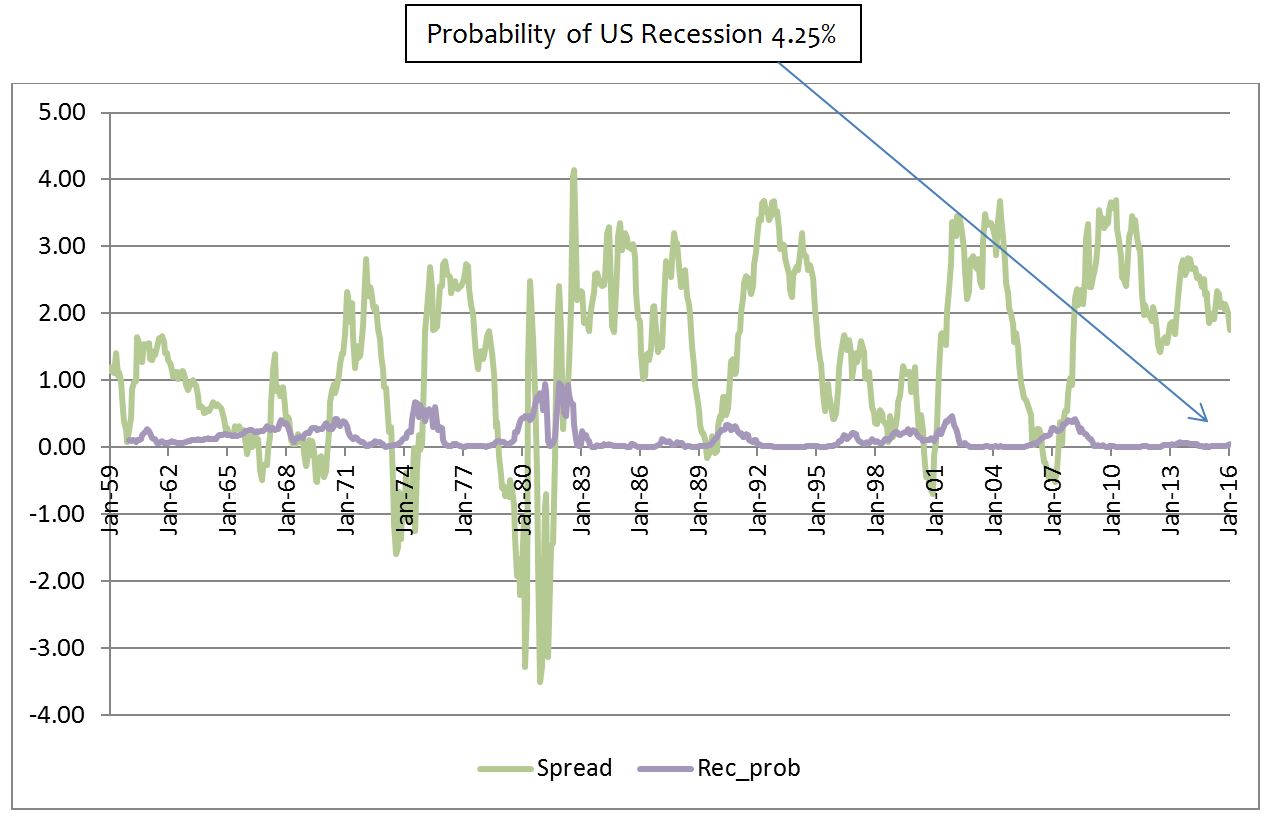
Some of the best economic data is free and available at the various Federal Reserve websites. For example, the New York Federal Reserve regularly publishes the Probability of US Recession Predicted by Treasury Spread. This indicator, which derives its’ probability by looking at the spread between the 10-Year US Treasury and the 3-Month US Treasury, is currently predicting about a 4.25% likelihood of recession.
The formula for calculating GDP is relatively straight forward, but all changes in GDP aren’t equal. GDP is the combination of spending on Consumption, Investment, Government, Inventory Adjustments, and Net Trade. This formula is GDP = C + I + G +IA + (X – M). Furthermore, all GDP is not created equal. For example, most economists would agree that naturally occurring spending on Consumption & Investment is a better indicator of economic virility than government spending from temporary fiscal stimulus. Yet both have the same positive impact on GDP. Similarly, a strong consumer sector can cause imports (M) to increase which subtracts from GDP. A strong consumer importing goods is no cause for alarm.