The global economic recovery is in its sixth year of growth. While the length of recovery has been impressive, the pace has been slower than previous recoveries. In periods of rapid growth, choosing between investing in slower-growing, highly profitable companies or fast-growing companies with lower returns-on-equity (ROEs) can be tough. In these instances, measuring ROE to evaluate investment opportunities can get muddy because the value of the growth can overwhelm the ROE. However, when most firms are growing slowly, as they are now, paying more attention to ROE trends may help investors find market segments poised to outperform.
What is ROE?
ROE is one factor that shows investors whether the businesses they own are working hard for them or not. ROE is calculated by dividing the net income a corporation earns by its book value, which is the value of its assets minus any debts owed. A high ROE means the company produces large earnings from assets financed by stockholders. A low number suggests the business doesn’t earn its owners a high return on their investments.
The structure of businesses and accounting rules can affect the ROE. Technology companies, which have fewer physical assets, tend to have higher ROEs. Utilities, whose power plants and distribution grids often carry considerable value, tend to have lower ROEs.
When evaluating ROE, investors often focus on its current levels, trends and changes. Below are a few examples of how monitoring ROE can benefit investors.
U.S. Stocks Rally out of the Financial Crisis
The chart below shows the ROE for U.S. large caps beginning in 2008. The financial crisis hurt profits, pushing ROEs lower. In 2010, U.S. companies improved profitability dramatically, and the ROE continued to rise into 2011. While the ROE slipped in 2012, it has remained at high levels since 2010. The rapid recovery in profitability, and ongoing high levels, allowed U.S. stocks to post double-digit gains in four of the five years between 2010 and 2014. Even in a slow-growth world, healthy business can produce excellent returns.
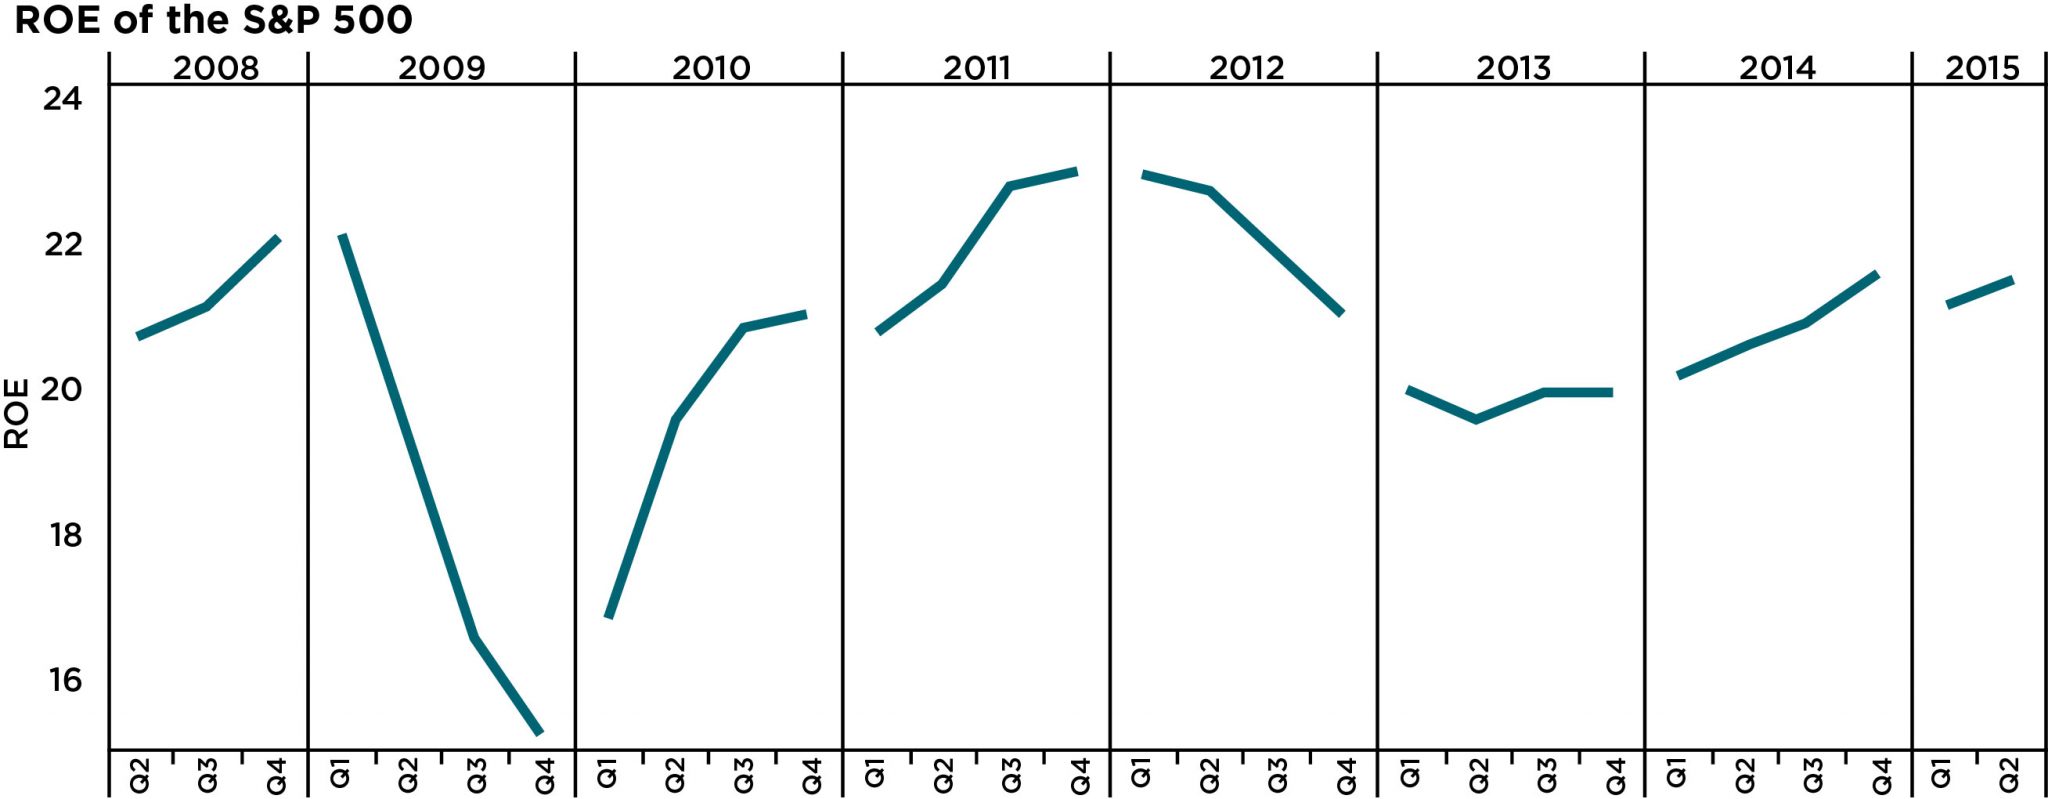
Healthcare Rises and Financials Fall
The chart below contrasts the ROE trend of the excellent-performing healthcare sector with financials. Before the financial crisis, the two industries produced similar levels of profitability. Because financial firms were at the epicenter of the crisis, their profits fell the most. In 2010, financial firms rallied both in profitability and performance. Since then, financial ROEs have stalled out well short of previous levels. While healthcare stocks fell during the crisis, their ROEs held up very well and remain at high levels. The performance shows healthcare has been rewarded, outperforming financials from 2011-2015 (with the exception of 2012).
The Rising Sun and the Shooting Star
The last chart shows another important point to consider when analyzing ROE: improvement matters. The chart subtracts the ROE of the U.S. stock market from the Japanese market. The first thing to note is the numbers are very negative. This means Japan’s ROE level has remained very low compared to the U.S. However, the Japanese government’s reform program includes efforts to improve corporate efficiency, and steady changes by Japanese firms have pushed the ROE higher in recent years. Investors have taken notice. Excluding swings in the exchange rate, Japanese stocks have outperformed the S&P 500 in 2012, 2014, and year-to-date.
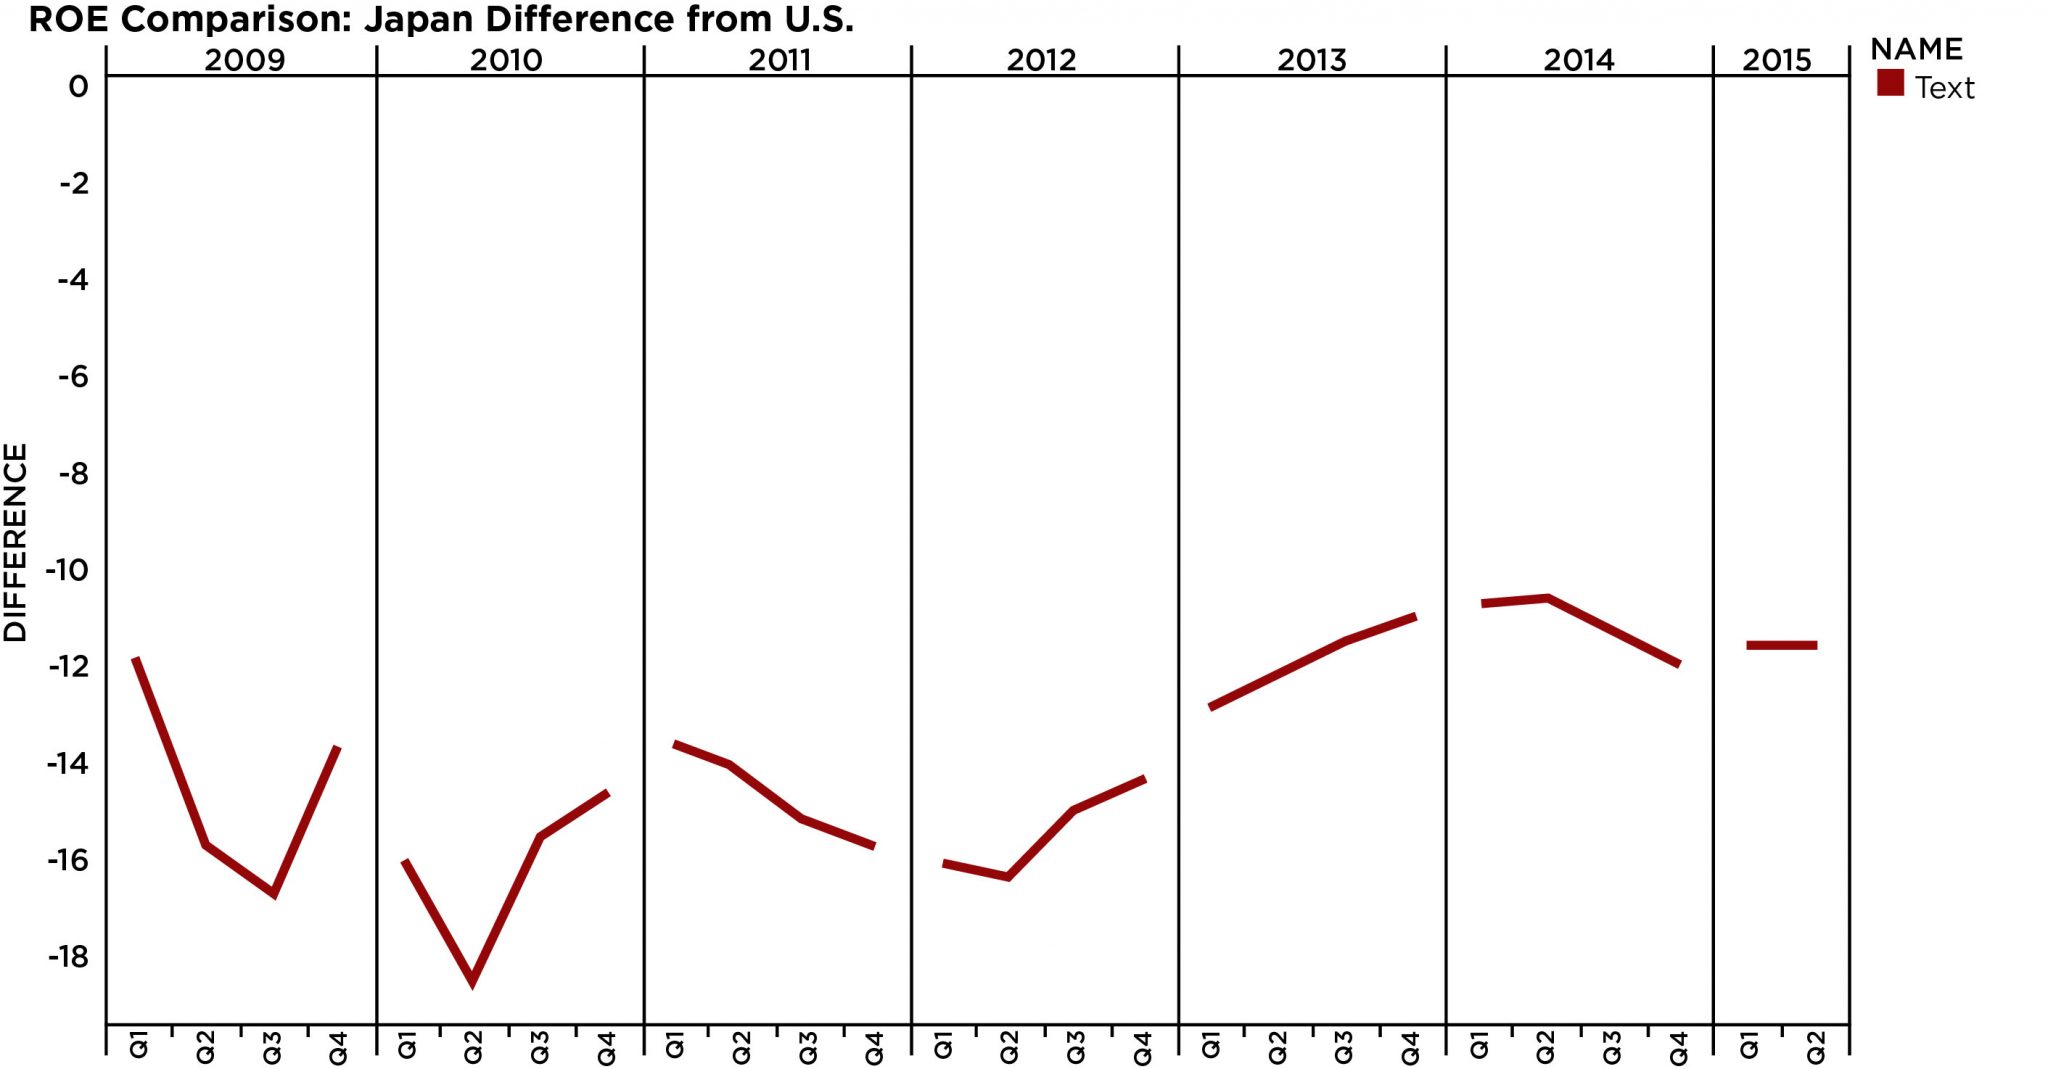
While global growth continues to lag, some asset classes, sectors, and countries have produced excellent performance for investors. And in this environment, it’s helpful to understand ROE trends and utilize this data to evaluate investment opportunities. Our research shows many of the strong performers are firms that have historically produced high returns on their equity investments or those that are able to make improvements from low levels.
Scott Kubie is the Chief Strategist at CLS Investments, which is a participant in the ETF Strategist Channel.