S&P Dow Jones Indices today announced the composition and weights for the 2016 S&P GSCI and Dow Jones Commodity Index. The two indices have the same constituents by definition but the weighting methodologies are different. The DJCI is equally weighted with 1/3 of its weight to each sector – energy, metals, and agriculture and livestock, then the constituents inside are liquidity weighted by the 5-year average of the total dollar value traded. The more interesting weighting of the two flagships happens in the world-production weight of the S&P GSCI. This is because the world production is a reflection of the relative significance of each of the constituent commodities to the world economy.
2015 was a historically significant year for oil in indexing since it was the first time Brent overtook WTI as the biggest commodity in the S&P GSCI since Brent Crude was added in 1999. Please see the graph below for the historical weight difference between WTI Crude Oil and Brent Crude in the S&P GSCI:
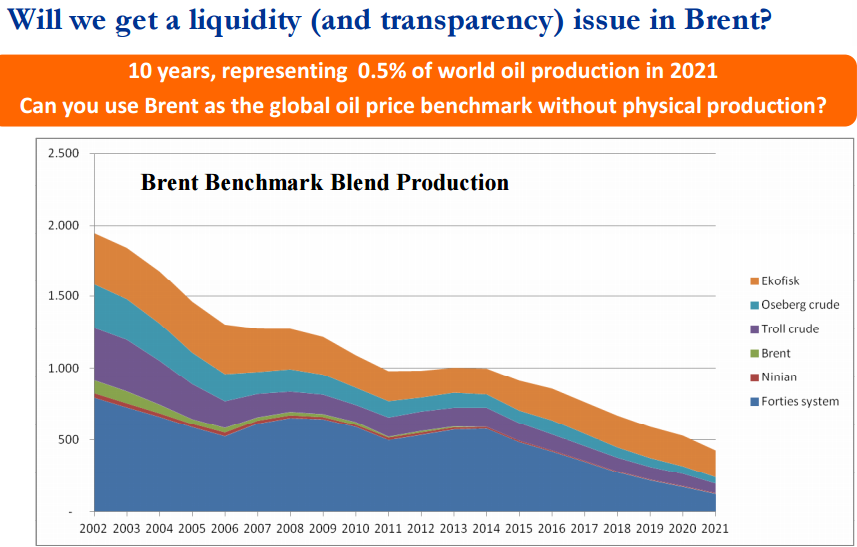
Notice the Brent significantly caught up to WTI in 2013, but now WTI is set to outweigh Brent in 2016 by even more than in 2013, putting into question Brent’s ability to hold as a real oil benchmark. Although the brent field only produces about 1,000 of 94 million barrels per day, volumes of the contract have more than doubled since 2009 to more than a million contracts per day. It is this volume (in addition to price) that catapulted brent to compete with WTI as the global heavyweight in the S&P GSCI. The index uses a world production for the entire petroleum component (WTI, Brent, Gasoil, heating Oil and Unleaded Gasoline) then adjusts the individual constituents by a 12 month average of total dollar value traded based on price and volume from the current year’s August through the prior year’s September. Based on this, the index is now reflecting what the rest of the world already suspects – that is brent is drying up too quickly to remain a global oil benchmark. For example, below is a chart from our commodity conference in 2012 questioning the viability of Brent.

A bigger question for benchmark pricing and index weight is how the composition of the brent contract may change to stay competitive. The brent field’s output used to be 100% of the brent contract but is now only at 0.1%. Please see the chart below of the decline from a WSJ blog: