- Last Friday utilities stocks plummeted 3.5% while broader stock market was little changed
- This was a good example that utilities stocks act as a combination of stocks and bonds. Factor and correlation analyses confirm this notion.
- An investor may want to attribute XLU partially to equities and fixed income for performance analysis purposes.
I am long the US utilities sector in my portfolio, thus it was not pleasant to see Utilities Select Sector SPDR ETF (XLU) close 3.49% lower last Friday. And this was on a day when broader US equities barely moved, with SPDR S&P 500 ETF (SPY) losing only 0.05%. The trigger behind this violent drop in utilities was the unexpectedly strong nonfarm payrolls report, which prompted market participants to reprice the probability of the Fed rate hike in December to 70%. This development encouraged me to do a bit of analysis on XLU price behaviour and clarify its role in my portfolio.
Factor analysis
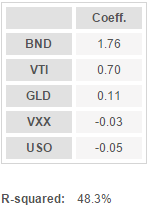
To better understand the driving forces behind XLU returns, I ran a simplistic factor analysis on InvestSpy.com. It uses 5 ETFs representing different market segments (equities, bonds, gold, oil and volatility) as explanatory variables in an unconstrained linear regression. Utilizing 1 year of historical data, the results are as follows:
What the table above means is that to replicate returns of $1,000 invested in XLU as closely as possible, one would need to go long $1,760 in bonds, $700 in equities, and $110 in gold, whilst shorting $30 of volatility and $50 of oil. The R-squared metric means that such a portfolio would have explained 48.3% of XLU performance. This leaves more than 50% of returns unaccounted for though and there are a couple of good reasons for that. Such a basic form of factor analysis possibly leaves out some other significant variables, whereas a portion of returns is naturally expected to be specific to the utilities sector only.
Statistics aside, the key practical takeaway is that XLU is primarily dependent on the bonds market at the same time exhibiting characteristics of equities. Given that stocks are substantially more volatile than fixed income securities, it is fair to say that XLU is a blend of both markets.
Correlation analysis
The conclusion from the previous section is reinforced by a closer inspection of the correlation coefficients presented in the table below:
