The S&P GSCI Total Return lost 19.3% in the third quarter of 2015. This was the 5th worst quarter and the 3rd worst 3rd quarter for commodities in history since 1970. Historically worse quarters were: Q4 2008 (-47.0%,) Q3 2008 (-28.6%,) Q4 2014 (-27.7%,) and Q3 1976 (-20.2%.) In total, there have been 183 quarters where 67 were negative and 116 were positive. On average, there was a gain of 8.6% in positive quarters and a loss of 8.2% in negative quarters. Historically, the 3rd quarter has been the most profitable, gaining an average of 4.3% but has also been the most volatile with annualized volatility of 28%. The best quarter ever was also a 3rd quarter that happened in 1990 and returned 55.2%. Only the 4th quarters on average have been negative, losing on average 0.4%. There is no guarantee of a rebound as the quarters following the four worst quarters on record (that were worse than this one,) lost 10.6% (Q1 2009), lost 47.0% (Q4 2008,) lost 8.2% (Q1 2015,) and gained 5.2% (Q4 1976.)
For the quarter, 23 of 24 commodities posted negative returns, which only happened once before in Q3 2008. It is a drastic change from Q2 2015, the prior quarter, when only 11 commodities were negative. Below are charts of the percentage of negative and positive commodities (since the number of commodities has not always been 24 like today) quarterly through history: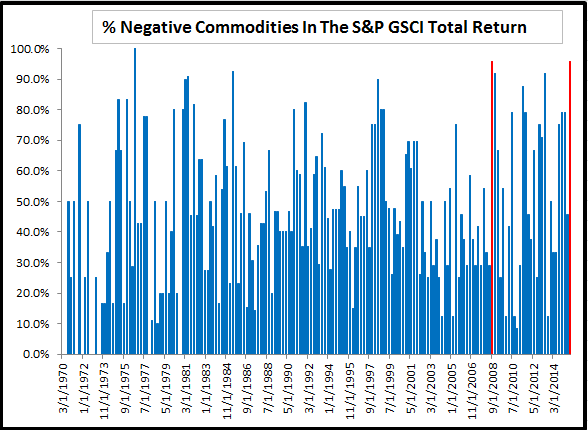 Source: S&P Dow Jones Indices
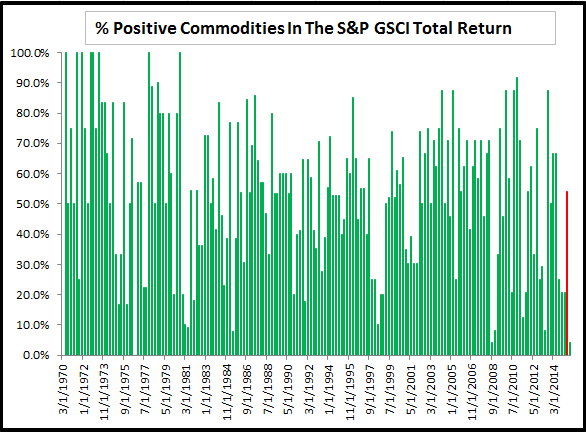 Source: S&P Dow Jones Indices
The S&P GSCI Lean Hogs was the only winner for the quarter and gained 13.4%. Back in Q3 of 2008, the S&P GSCI Lead was the only winner. The S&P GSCI Feeder Cattle was the only single commodity index to set a losing record return this quarter, losing 17.2%. However, one quarter of the 24 single commodities were notable quarterly losers posting losses worse than 20%: crude oil (-26.9%,) brent crude (-26.5%,) Kansas wheat (-21.2%,) unleaded gasoline (-21.0%,) heating oil (-20.9%,) and gasoil (-20.7%.) Some single commodities in the index also had their biggest losses in quite a long time: live cattle (-14.6%, worst since Q4 2008,) zinc (-15.9%, worst since Q3 2011,) and copper (-10.2%) and aluminum (-7.9%) each lost most since Q2 2013.
Year-to-date through September, 2015 is the 3rd worst year recorded, losing 19.5%. Only 2001 and 1998 were worse ytd through Q3, losing 23.2% and 21.9%, respectively. Now the S&P GSCI Total Return is on track to record its 6th worst year after 2008 (-46.5%,) 1998 (-35.8%,) 2014 (-33.1%,) 2001 (-31.9%) and 1981 (-23.0%.) Perhaps some good news for 2016 is that in the years following these historical losses, returns were positive 13.5%, 40.9%, 32.1% and 11.6%, respectively, in 2009, 1999, 2002 and 1982.
To hear the best calls for the coming year, please tune into our expert panel from the S&P Dow Jones Indices 9th annual commodity seminar.
– See more at: http://www.indexologyblog.com/2015/09/30/commodities-post-3rd-worst-q3-since-1970/#sthash.4S8R1V7P.dpuf
