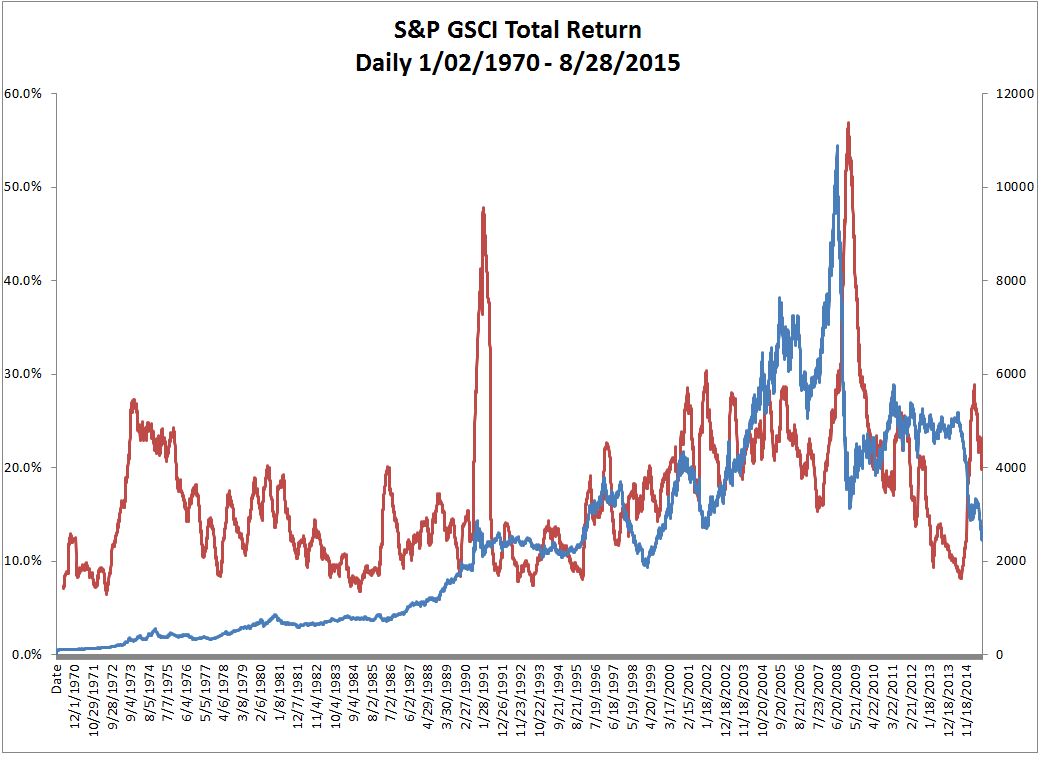
While the index rose 85.3% until Apr. 8, 2011, it has now given up 53.8% and has created a new biggest drawdown of 77.5% as of Aug. 26, 2015. It is yet to be seen whether the fall will continue but what is concerning besides the difficult fundamentals is that the volatility is still not historically high. Historically the volatility has spiked, becoming too volatile for investors hence causing them to sell. This has driven drops in open interest in historical crises that we haven’t seen yet.
To hear more expert opinions about commodities, please join us for our 9th annual commodity seminar.
Source: S&P Dow Jones Indices LLC. Daily Data from Jan. 2, 1970 – Aug. 28, 2015. The launch date of the S&P GSCI was May 1, 1991. All information presented prior to the index launch date is back-tested. Back-tested performance is not actual performance, but is hypothetical. The back-test calculations are based on the same methodology that was in effect when the index was officially launched. Past performance is not a guarantee of future results. Please see the Performance Disclosure at http://www.spindices.com/regulatory-affairs-disclaimers/ for more information regarding the inherent limitations associated with back-tested performance.
This article was written by Jodie Gunzberg, Global Head of Commodities at S&P Dow Jones Indices.
© S&P Dow Jones Indices LLC 2013. Indexology® is a trademark of S&P Dow Jones Indices LLC (SPDJI). S&P® is a trademark of Standard & Poor’s Financial Services LLC and Dow Jones® is a trademark of Dow Jones Trademark Holdings LLC, and those marks have been licensed to SPDJI. This material is reproduced with the prior written consent of SPDJI. For more information on SPDJI, visit http://www.spdji.com.
