On the surface, the most basic commodity beta, the S&P GSCI, hasn’t done much in 2015. It is down just 21 basis points (bps) for the year after losing 11 bps in June. Further, only 9 of 24 commodities are positive year-to-date with the overall term structure in contango after two years of structural backwardation. Coffee, lean hogs and nickel are the biggest losers for the year, down 24.6%, 24.5% and 21.5%, respectively. However, unleaded gasoline, cocoa and cotton that are up the most of 20.3%, 12.4% and 10.7%, respectively, have gained significantly.
Please see the table below for sector performance through June 30, 2015:
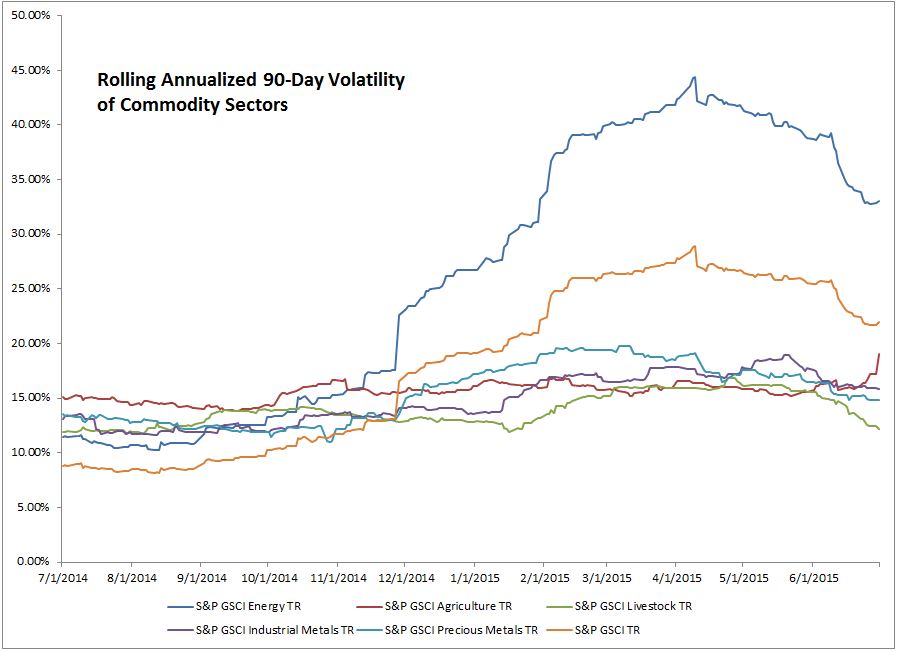
Most interesting in 2015 thus far is the volatility in commodities with 9 of 24 commodities posting double-digit moves for the year. The volatility in energy peaked in early April followed by an industrial metals spike in May. The performance of energy has been so dominated by oversupply that its response to the economy has been masked. However, industrial metals, also known for its economic sensitivity had spiked together with energy in April – that was indicative of a contraction, and these sectors followed with weak performance. The volatility with the poor performance was finally enough to drive a new wave of investor selling that may be just the catalyst needed to stabilize the market. If open interest collapses, then production may slow as insurance in the futures market becomes too expensive. Historically in high volatility periods, open interest needs to collapse before oil finds stability again.