Chart Courtesy: Larry Tentarelli
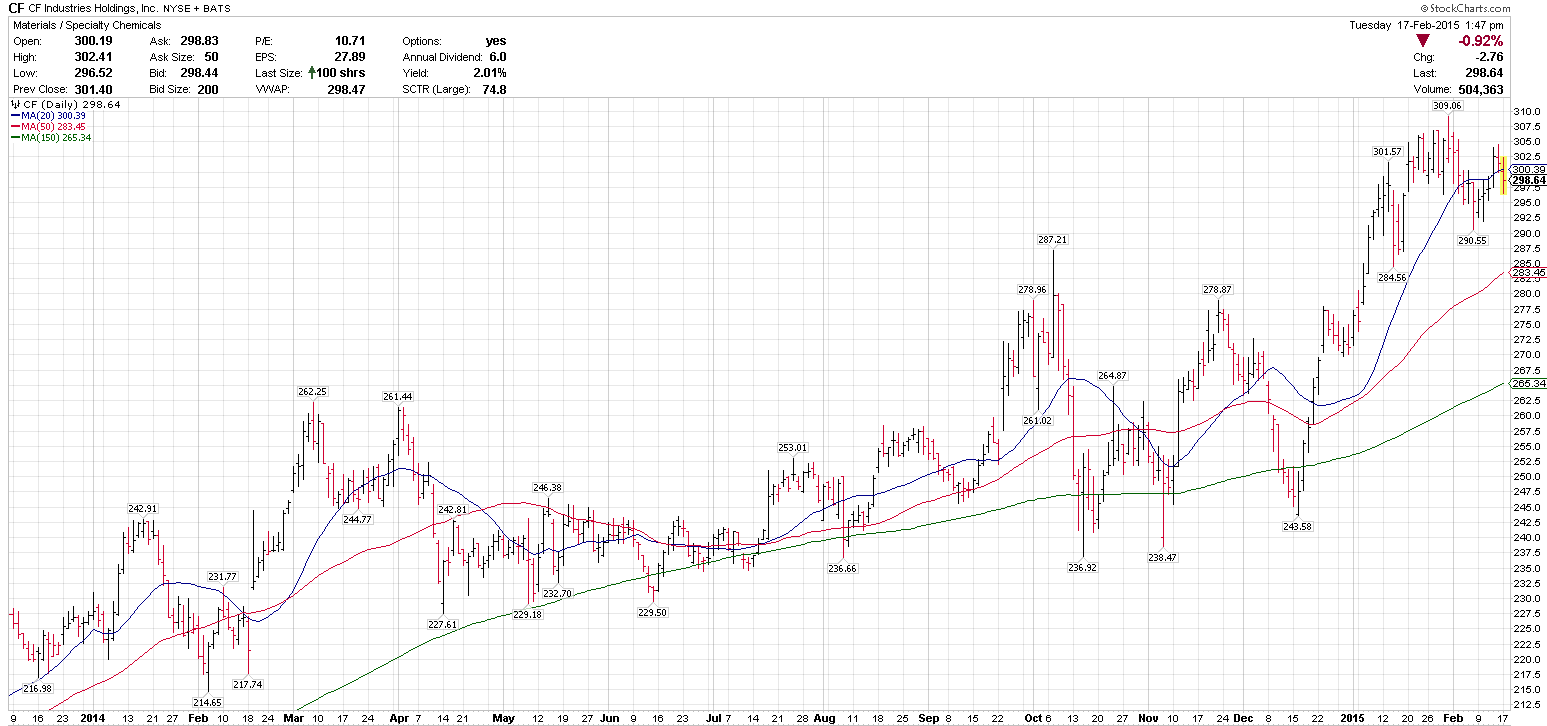
Importantly, MOO’s marquee names are leading the ETF higher. Syngenta (NYSE: SYT) and CF Industries (NYSE: CF) are up an average 9.1% this year while the latter is also flirting with record highs. Nine of MOO’s top 10 holdings have traded higher this year, led by Agrium (NYSE: AGU) and Mosaic (NYSE: MOS), each of which are up roughly 14%. Agrium, Mosaic and CF Industries combine for about 12% of MOO’s weight.
Chart Courtesy: Larry Tentarelli
MOO tells another story investors should listen to: ETF flows data is not always an accurate harbinger of that fund’s future performance.
There was a time when MOO was the largest Market Vectors ETF. After losing nearly $3.1 billion in assets last year, a total exceeded by just three other ETFs, MOO is now a $1.5 billion ETF. Call it capitulation or frustration-induced selling. Either could be accurate, but what was not accurate were those outflows indicating more pain for MOO because the opposite has been true to this point in 2015.
