Specifically, the weekly relative strength chart of HGX versus the S&P 500 shows a downtrend dating back to late 2012. However, the chart is forming an inverse head and shoulder with the head at the mid-October low – the bullish technical indicator predicts a reversal of a prolonged downtrend.
Looking at the fundamental factors, market observers argue that the improved construction prospects, a better labor market and lower borrowing costs could all support the homebuilder industry.
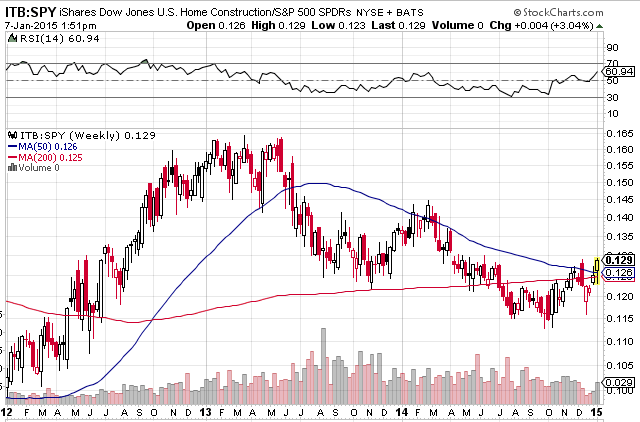
The following chart depicts the relative strength of iShares U.S. Home Construction ETF versus the S&P 500 on a weekly basis.
For more information on the housing sector, visit our homebuilders category.
Max Chen contributed to this article.
