Silver bulls have probably had enough. When including leveraged exchange traded products such as the ProShares Ultra Silver (NYSEArca: AGQ) and the VelocityShares 3x Silver ETN (NYSEArca: USLV), several of the worst-performing ETFs over the past six months are silver funds.
Year-to-date, the iShares Silver Trust (NYSEArca: SLV) and the ETFS Physical Silver Shares (NYSEArca: SIVR) are each down more than 12%, but that has not been enough to chase investors from those ETFs. While the SPDR Gold Shares (NYSEArca: GLD) has bled over $2.8 billion in assets this year, SLV, the largest physically-backed silver ETF, has added over $494 million in new assets this year. [Investors Remain Loyal to Silver ETFs]
Silver bulls are being rewarded for their faith as SLV and SIVR are up an average of 8.4% in the past month and those one-month gains could be just the start of an epic silver rally.
Peter Brandt of Factor LLC, a proprietary trading firm and provider of research to institutional clients, outlines some important technical reasons why one of the worst bear markets in silver’s history may be drawing to a close and why a significant rally could ensue.
“The decline from the April 2011 high has taken the geometric form of a falling wedge. Falling wedges are a common formation to correct a previous bull trend. It must be noted that the completion of a falling wedge seldom results in a ‘V’-extended bottom. Rather, wedges tend to produce a ‘backing-and-filling’ or ‘rounding-out’ advance,” notes Brandt in a post on StockTwits. “The decline to the December low finally met the target of the bearish rectangle completed in April 2013.”
Silver’s rebound is outpacing that of gold as traders snap up the relative cheaper precious metal. Over the past four decades, the silver-to-gold ratio has hovered around 55-to-1, or the value of 55 ounces of silver to the value of one ounce of gold.
According to Kitco, the ratio is up to about 72-to-1. The higher ratio reveals that either silver is too cheap or gold is too expensive on a historical basis. [Surprises From Silver ETFs? Maybe]
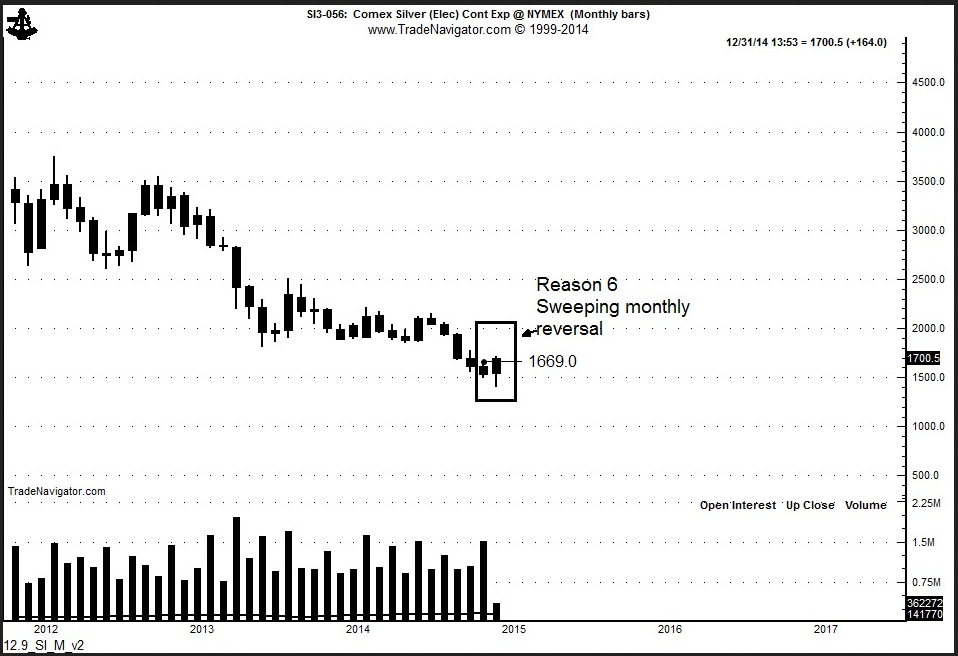
Brandt notes that December is a big month for silver, pointing that if the white metal’s price remain firm “the monthly chart will complete a sweeping key reversal — and this is a powerful sign the bottom is in place.”
“I think a logical place for a rally to stop over the next year or so will be a test of the bank of lows on the monthly chart at around $26,” he said.
A move to $26 for SLV implies upside of more than 58% for the ETF.
Silver Monthly Chart
Chart Courtesy: Peter Brandt
ETF Trends editorial team contributed to this post. Tom Lydon’s clients own shares of GLD.