As investors, we necessarily rely on history. How we analyse that history is particular to each investor – some will look for technical patterns, some at fundamental data, still others will build quantitative models. But all of us need data, and history is our only source.
We may have to rely on history; we don’t have to fall prey to what the behavioural economists would call “recency bias.” Indeed, taking a longer-term view can provide invaluable perspective. Two popular views of the current environment provide a specific example:
- Unprecedented levels of low volatility driven by central bank stimulus in the past two years have caused the market to become complacent; valuations are proof positive of a stock market bubble.
- Moreover, when the bubble “pops”, the modern market of leveraged derivatives, high frequency trading and globalized capital has engendered a greater risk of systemic volatility and, when things get interesting they are going to get very interesting, very fast.
A running thread in both theories is the “risk on/risk off” dynamic. We are now either in utter turmoil or dulcet calm, each exaggerated by the rapid and capricious response of a highly mobile and sophisticated investment community.
An examination of recent history would appear to support these claims. It certainly looks like a new, more volatile dynamic since the beginning of the financial crisis. And as we all know, volatility has registered remarkably low levels more recently. Are we set to continue in a bar-belled digital age of all volatility, or none?
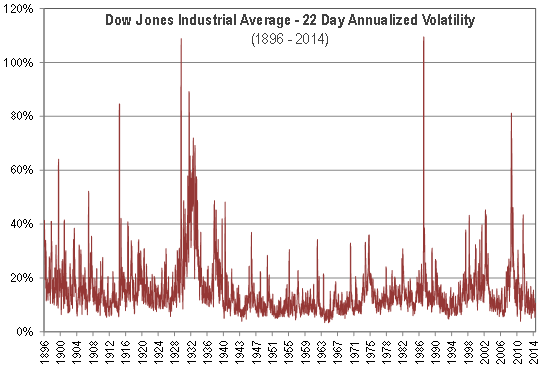
Now, there is a good reason why the chart above begins in 1990. The VIX data begin then; we don’t know what the VIX would have been during the “black Monday” crash of 1987 (although there are clues, they suggest the answer is higher than at any point subsequently). Nor do we have any idea of the appropriate level of implied volatility during the “Knickerbocker Crisis” of 1907.
However, what we do have – in the Dow Jones Industrial Average – is a market bellwether with a remarkably comprehensive history. Here is 118 years of realized monthly volatility in the DJIA:
