We have heard for many years now about the Chinese super-cycle that supported commodity prices since 1999 and we have also heard many debates about whether it has ended. So if it has ended what now? How huge is the impact on commodity prices?
That all depends on the level of inventories that result from the combination of supply and demand. Theoretically if there were no inventories or supply, it wouldn’t matter how much Chinese demand fell. They could demand all they wanted but there would be no price impacts if there were no supply or inventories. Realistically this is not the case but there are shortages in various commodities, so the slowdown in Chinese demand growth matters more for some commodities than others.
Another point to remember is that Chinese demand does not slow equally in all areas. Construction, automobile demand and food demand all require different natural resources, so it is understandable that copper, palladium, gasoline and soybeans may not move together. China has also been known to stockpile resources at various times, which may influence the available inventories like in cotton last year.
First let’s take a look at the slowdown in GDP growth from China. In 2013 the growth was 7.7%, roughly the same as in 2012, which is also close to 1998-99 levels and almost half as much as in 2007 when it was 14.2%. There is no correlation (0.04) between the total returns of the S&P GSCI and Chinese GDP growth, while there is only slightly positive correlation of the commodities to the GDP growth of the US at 0.23 and UK at 0.30.
Source: S&P Dow Jones Indices and Bloomberg. Data from Jan 1978 to Dec 2013. Past performance is not an indication of future results. This chart reflects hypothetical historical performance. Please note that any information prior to the launch of the index is considered hypothetical historical performance (backtesting). Backtested performance is not actual performance and there are a number of inherent limitations associated with backtested performance, including the fact that backtested calculations are generally prepared with the benefit of hindsight.
Further, let’s take a look at the supply and demand situations a few of the mainstay commodities. According to IEA’s March Oil Market Report, although the OPEC and Non-OPEC supply has increased roughly 2 mb/d yoy, it is against a backdrop of staggering inventory draws from a cold snap in the US. From this, the oil stock deficit to the seasonal average is at 154 mb, its widest in more than a decade.
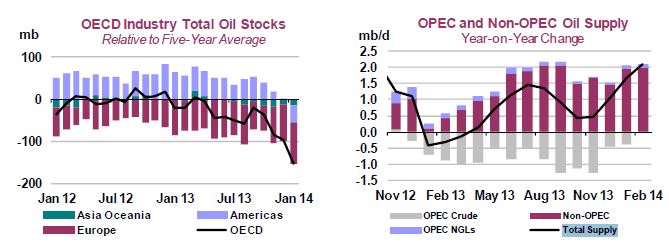
International Energy Agency (IEA) March 2014 Oil Market Report.
Now let’s evaluate the demand side of oil, and again, what does a slowdown in Chinese demand mean? It depends on the commodity, even within the oil complex. For example gasoil has had the slowest growth yoy in 2013 of -1.6% and 2.5% (projected by the IEA) in 2014 since the demand for transporting coal has dropped. This translated into 54 kb/d coming off demand in 2013 but 83 kb/d coming back on in 2014 (projected by the IEA). However, gasoline demand has been relatively strong with a 6.5% growth in 2013 and 6.2% (projected by the IEA) in 2014 adding up to 129 kb/d in each year of 2013 and 2014 fueled by car sales.
