Source: S&P Dow Jones Indices and/or its affiliates. Data from Jan 1981 to Feb 2014. Past performance is not an indication of future results. This chart reflects hypothetical historical performance. Please see the Performance Disclosure at the end of this document for more information regarding the inherent limitations associated with backtested performance.
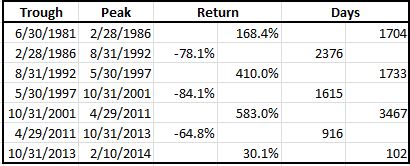
Historically, the major drawdowns have lasted on average about 5.5 years with a loss of 81.1%. The gains from trough to peak on average with the exception of the 2008 financial crisis period lasted 4.8 years with average gains of 387.1% that includes the gain between 2011-2011. The last drawdown ending 10/31/2013 only lasted 2.5 years and was only down 64.8% before gaining 30.1% until now. If the next drawdown looks like the past, it is possible to see a downward spiral for another 2.5-3 years with a loss of 58.6%. Please see the table below:
About Jodie Gunzberg
Jodie M. Gunzberg is vice president at S&P Dow Jones Indices. Jodie is responsible for the product management of S&P DJI Commodity Indices, which include the S&P GSCI® and DJ-UBS Commodities Index, the most widely recognized commodity benchmarks in the world. Both indices represent the global commodity market and are most commonly used for the historical benefits of inflation protection and diversification to stocks and bonds.
© S&P Dow Jones Indices LLC 2013. Indexology® is a trademark of S&P Dow Jones Indices LLC (SPDJI). S&P® is a trademark of Standard & Poor’s Financial Services LLC and Dow Jones® is a trademark of Dow Jones Trademark Holdings LLC, and those marks have been licensed to SPDJI. This material is reproduced with the prior written consent of SPDJI. For more information on SPDJI, visit http://www.spdji.com.
