Happy Chinese New Year for all celebrating! As a special tribute, this post will focus on the fact that all 5 commodities that start with the letter “c” (the same letter China starts with) in the S&P GSCI Agriculture and Livestock have had positive returns in 2014. I picked the agriculture and livestock to symbolize the importance of food for the year. Further to honor the new year, I will specifically highlight how China has influenced each of these commodities.
Let’s start with a general cumulative performance chart (and notice the special celebration colors of red and gold for extra luck!) of each of the commodities that start with the letter “C” that are in the agriculture and livestock sector. Based on monthly returns from 2002, the last year of the horse, cocoa and cattle (two of my favorite commodities) performed well, returning 82.7% and 3.6%, respectively. Unfortunately, coffee, corn and cotton were less fortunate and lost 38.5, 31.2 and 21.2%, respectively.
Source: S&P Dow Jones Indices. Data from Feb 2002 to Jan 2014. Past performance is not an indication of future results. This chart reflects hypothetical historical performance. Please see the Performance Disclosure at the end of this document for more information regarding the inherent limitations associated with backtested performance.
Under which signs were food commodities that start with “c” most successful? The last year of the horse did very well, returning on average 26.3% with a stellar cocoa performance of 86%. In fact, the only sign that had better average performance was the TIger. (That’s my sign so is probably why I’m a commodity lady!) Check out the table below to see performance in the last cycle by sign:
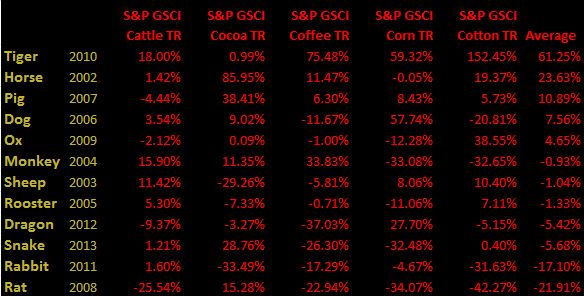
Source: S&P Dow Jones Indices. Data from Feb 2002 to Jan 2014. Past performance is not an indication of future results. This chart reflects hypothetical historical performance. Please see the Performance Disclosure at the end of this document for more information regarding the inherent limitations associated with backtested performance. Also please note the years in the table are not exact calendar years but coincide with the Chinese calendar months.
