The S&P 500 (^GSPC) hit another record high on Wednesday, the 34th this year. Market history buffs will enjoy this nugget: The S&P 500 has hit 1,020 new closing highs since 1928, according to S&P Capital IQ’s senior index analyst Howard Silverblatt.
If there is cause for concern it comes by way of these tidbits: On Wednesday, fewer than 12% of S&P 500 members made new 52-week highs. On the ETF front, 111 made new 52-week highs, not a great percentage from a universe of about 1,500.
There are some reasons to be encouraged though, one being the S&P 500 is not overbought at the moment.
“After trading sideways since the end of October, the S&P 500 staged another breakout to new all-time highs today. As shown in our trading range chart below, the index never managed to pull below overbought territory (>1 standard deviation above its 50-DMA) over the last two weeks. Instead, the index’s moving averages played catch-up, so even though it’s higher than it was when it last hit an all-time high, the S&P is less overbought now than it was then,” according to Bespoke Investment Group.
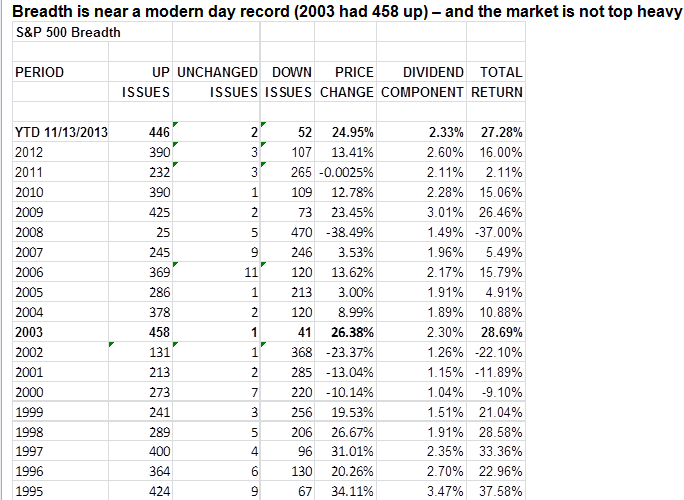
Silverblatt notes “breadth is near a modern day record; YTD 446 are up and 52 are down, with 221 up 30%, 134 up 40%, and 79 up at least 50%.” [Market Breadth Improves]
As the chart below indicates, market breadth is strong.
Chart Courtesy: S&P Capital IQ. Click to enlarge.
