With the market fixated on risks of “tapering,” investors are shortening their duration (and appear to be running for the hills) in fixed income.
As exposure to any interest rate risk has fallen out of favor, the overwhelming flow leaders in fixed income so far this year have been short-duration, credit-focused products.1 While we can’t argue with investor flows, we can turn our attention to another short-duration position that despite its performance has been largely overlooked by investors so far this year: the Chinese yuan.
As we will discuss, the Chinese yuan has provided steady returns to investors, with comparatively attractive levels of volatility when compared to some of the fastest-growing assets this year. As investors attempt to navigate this period of global rebalancing, the yuan has quietly continued along a path of modest appreciation.
Absolute and Risk-Adjusted Returns
In absolute terms, the Chinese yuan has performed unusually well during a period of broad-based U.S. dollar strength. In our view, given the low income potential/opportunity cost in short-duration fixed income, investors could consider positions in the Chinese currency as a way to diversify their portfolios beyond the U.S. dollar and away from U.S. interest rate risk.
When compared to other foreign currencies, the Chinese yuan has been broadly stable despite the sometimes volatile moves in emerging markets. This is largely a product of the “managed band” that Chinese policy makers currently impose on the yuan. Although the band prevents large upside surprises, the downside is also capped, which could be attractive to investors seeking to limit volatility. Additionally, investors have also benefited from the higher interest rates available from short-term investments in the yuan, boosting total returns relative to spot.
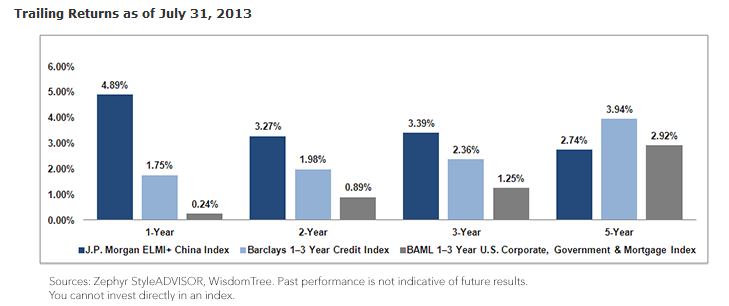
When taking into account the yuan’s historic volatility (approximately 2.4%), investors in China’s currency have achieved higher risk-adjusted returns than virtually all fixed income or currency investments so far in 2013.2 In the graph below, we track the rolling 12-month Sharpe ratio of the J.P. Morgan ELMI+ China Index and two short-term fixed income indexes representing the fastest growing sector of fixed income in 2013. As volatility has increased in U.S. interest rates and returns have waned, the Sharpe ratios of U.S. fixed income have tended to trend downward. By comparison, consistent volatility and positive performance have contributed to the yuan’s current upswing.
