A Technical breakout confirms an important low has been generated
Arguably, the longer-term relative strength chart above is quite compelling on its own merits.
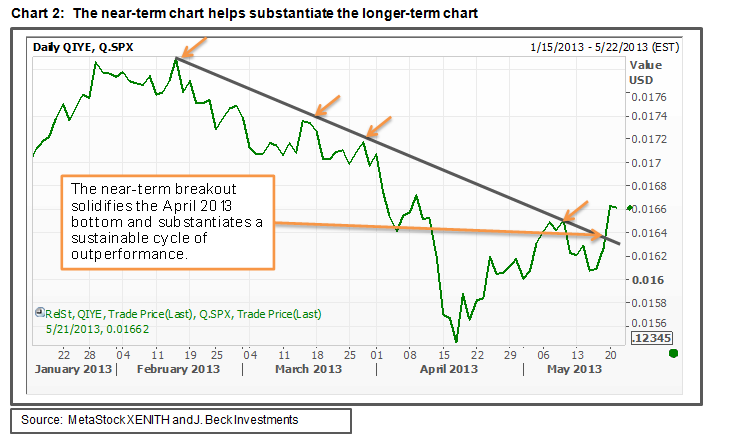
However, this near-term chart adds valuable supportive technical evidence that IYE has begun a sustainable period of outperformance. In other words, the breakout from the February 2013 downtrend line solidifies the April 2013 bottom and suggests that the outperformance may still be in its early stages.
From a sector rotation point of view, look towards the Energy sector as a way to achieve alpha in your portfolios.
Higher prices also seem to be in the cards
The iShares U.S. Energy ETF has recently broken out of a large two and a half year symmetrical triangle pattern. This coupled with the relative strength breakout (shown above) suggests that IYE has become a technical leadership sector ETF within U.S. equities. The technical breakout now opens the door for a move up towards the 2008 peak of 52.67.
In fact, the target derived from this breakout is closer to 60. In order to protect profits and manage risk, initial support should correspond to breakout level near 45.60. Secondary support corresponds to the April 2013 low (41.96).

J. Beck Investments is an independent provider of technical research for ETFs.
